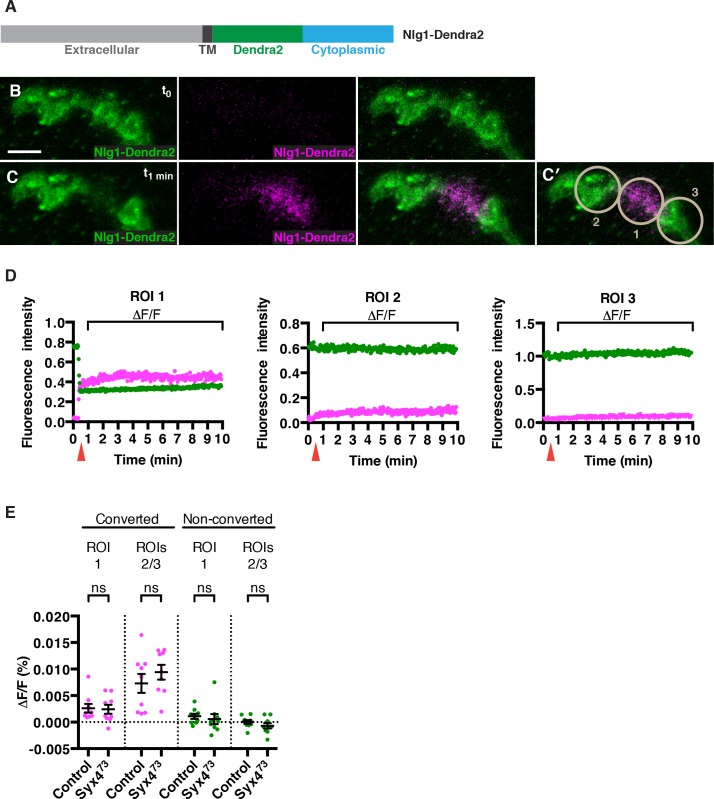
Figure 6. No change in mobility of Neuroligin 1 is observed in Syntaxin 4 mutants.
(A) Nlg1-Dendra2 construct. The Dendra2 tag was placed between the transmembrane domain and the cytoplasmic tail. (B–C) Representative image from a single animal expressing Nlg1-Dendra2 in the postsynaptic cell. One bouton (ROI1) was targeted with a 405 nm laser for photoconversion of the Dendra2 tag after 1 min. Non-photoconverted Nlg1-Dendra2 is shown in green and photoconverted Nlg1-Dendra2 is shown in magenta before (B) and immediately after (C) photoconversion. (C′) Regions of interest: ROI1, photoconverted region; ROIs 2 and 3, adjacent regions. (D) Fluorescent intensity over time for photoconverted and non-photoconverted molecules in all three ROIs. Red arrows indicate time of photoconversion. (E) Quantification of ΔF/F of both photoconverted and non-photoconverted molecules, in all three ROIs, in both the control and Syx473 mutant backgrounds. Data are presented as mean ± SEM. Scale bars = 5 μm. Statistical comparisons are fully described in Figure 6—source data 1; no significant differences found (ns = not significant).
DOI: http://dx.doi.org/10.7554/eLife.13881.017

