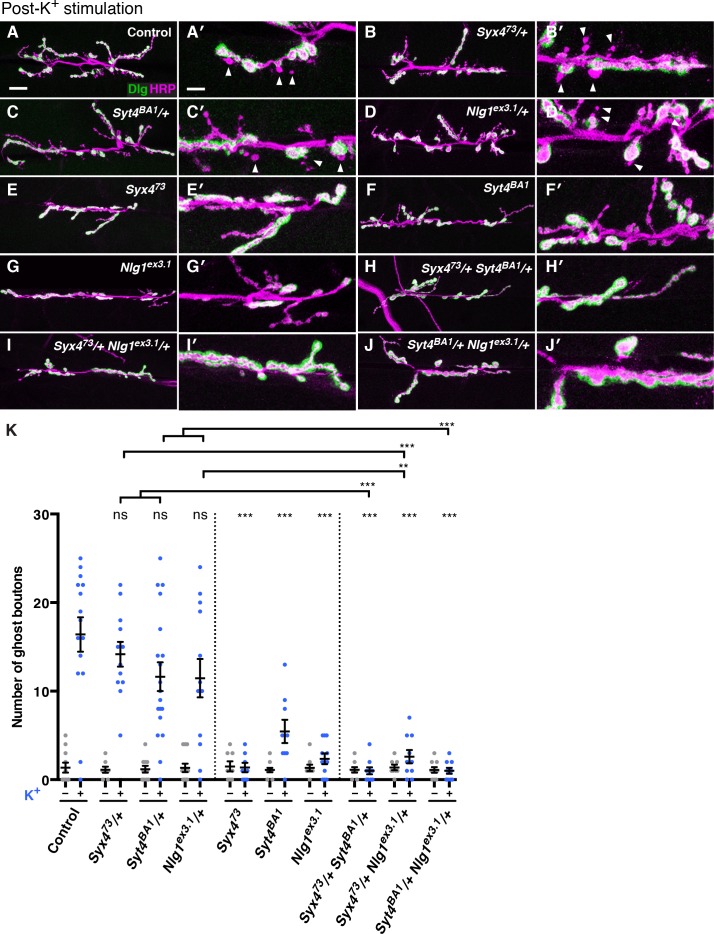
Figure 7. Syntaxin 4, Synaptotagmin 4, and Neuroligin 1 regulate acute structural plasticity at the NMJ.
(A–J) Representative images of NMJs stained with antibodies to HRP (magenta) and the postsynaptic marker Dlg (green) to highlight synaptic boutons. Ghost bouton budding was stimulated with spaced incubations in high K+. Ghost boutons are identified as round HRP+ structures lacking Dlg signal (arrowheads); images are shown from precise excision control (A), Syx473/+ (B), Syt4BA1/+ (C), Nlg1ex3.1/+ (D), Syx473 (E), Syt4BA1 (F), Nlg1ex3.1 (G), Syx473/+ Syt4BA1/+ (H), Syx473/+ Nlg1ex3.1/+ (I), and Syt4BA1/+ Nlg1ex3.1/+ (J) animals. (K) Quantification of ghost bouton number per NMJ from animals without (−) or with (+) high K+ stimulation. Data are presented as mean ± SEM. Scale bars = 20 μm (A–J), 6.7 μm (A′–J′). Statistical comparisons are fully described in Figure 7—source data 1, and are indicated here as ***p<0.001, **p<0.01, *p<0.05, ns = not significant; comparisons are with control unless indicated.
DOI: http://dx.doi.org/10.7554/eLife.13881.021


