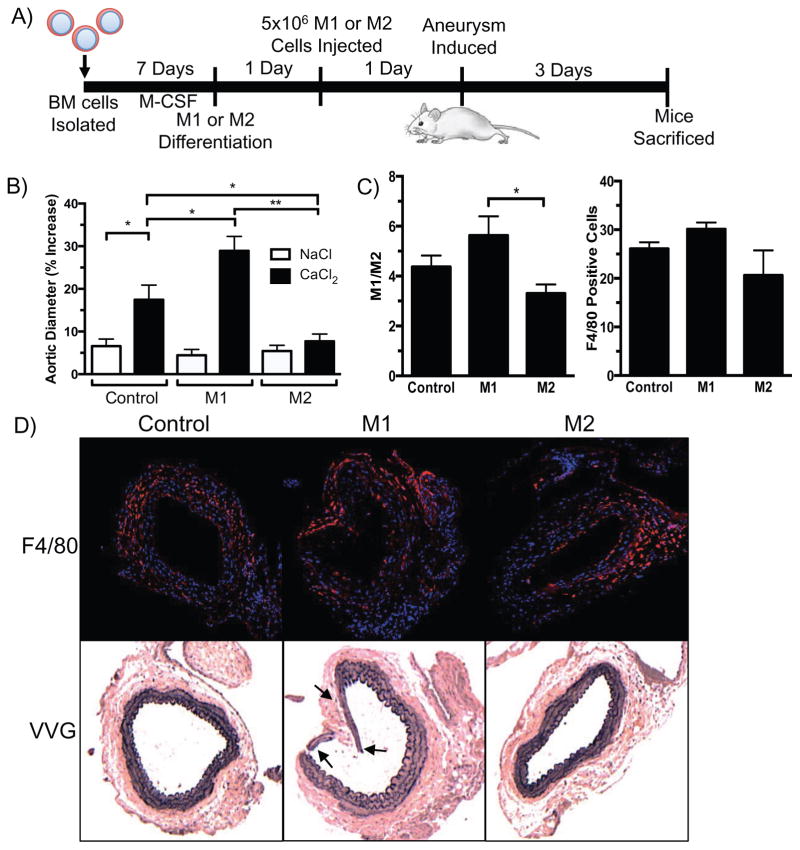
Figure 4.
M1 and M2 macrophage influence on aortic size three days after aneurysm induction. A) Schematic representation of methods three days after aneurysm induction and macrophage injection. B) Aortic diameter percent increase three days after aneurysm induction with injection of M1, M2, or no macrophages (Control) (n = 5–6 per group). NaCl was used as sham control. C) Bar graph on left represents M1/M2 ratio of M1 (CD86) to M2 (CD206) positive macrophages (F4/80) from flow cytometry (n = 5–6 per group). Right bar graph shows proportion of F4/80+ macrophages found in tissue. D) Representative immunofluorescence and VVG stained images of aortas three days after surgery and M1 or M2 macrophage injection (n = 3 per group). Top panel shows aortas stained with a rat anti-mouse F4/80 antibody (red), cell nuclei stained with DAPI (blue); bottom panel shows VVG stained aortas. Arrows indicate sites of elastin fragmentation or abnormal structure. Statistics performed using ANOVA and Student’s t-tests. Data expressed as mean ± SEM. *, P < .05; **, P < .01.

