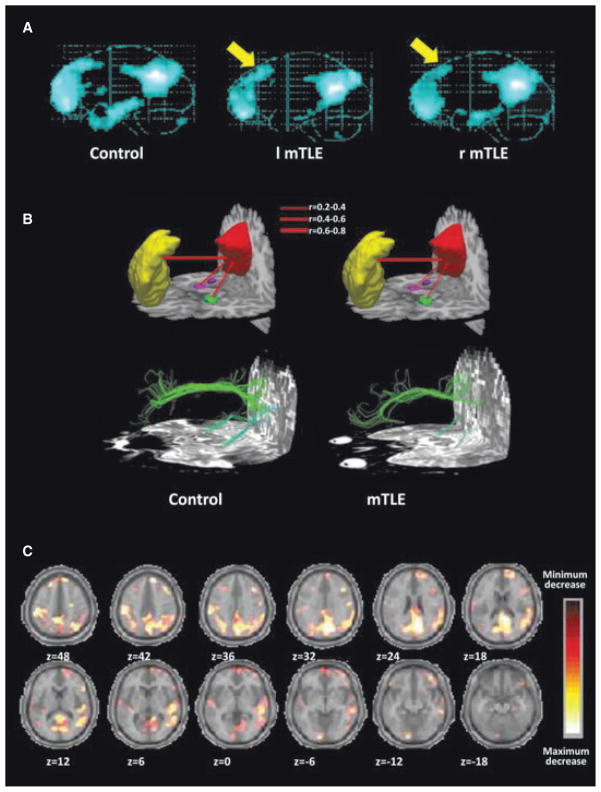
Figure 2.
TLE affects activity and connectivity of the default mode network (DNM). (A) Comparison of the DMN in control subjects, and right and left TLE patients. The images represent the averages of DMN signals reconstructed from the analysis of BOLD coherent fluctuations, in 29 control subjects, 27 right and 25 left TLE patients. Note the significantly smaller areas of the dorsal medial prefrontal cortex, and of the mesial and inferior temporal lobe in TLE patients in comparison with controls. Reproduced with permission from Zhang et al. (2010b) Brain Res 1323:152–160. (B) The connectivity among different regions of the default mode network is lower in TLE than in normal subjects. The top of the panel reports a schematic representation of fMRI functional connectivity between precuneus/posterior cingulate cortex (in red) and medial prefrontal cortex (in yellow), right (in magenta), and left (green) mesial temporal cortex. Functional connectivity was evaluated measuring the correlation coefficients of BOLD fluctuations in the aforementioned regions. The different strengths of correlations are represented as different thickness of the segments connecting these regions as specified in the inset of panel. Note that the connectivity between precuneus/posterior cingulate cortex and both right and left temporal lobes is weaker in TLE patients than in controls. The bottom of the panel shows a DTI reconstruction of the white matter fiber bundles connecting the same regions. Note that the thickness of these fibers is reduced in TLE patients as compared with normal controls. Reproduced with permission from Liao et al. (2011), Hum Brain Mapp 32:883–895. (C) Areas of the brain where BOLD signal decreases during the propagation of interictal epileptic activity. The panel shows the mean decreases in BOLD signals recorded during interictal epileptic discharges in nine different patients with TLE undergoing simultaneous fMRI and EEG monitoring. The data were expressed in pseudocolor using an arbitrary scale, and projected as colored areas onto axial slices (Z coordinates given below each slice) of a template average brain. Reproduced with permission from Laufs et al. (2007), Hum Brain Mapp 28:1023–1032.
Epilepsia © ILAE

