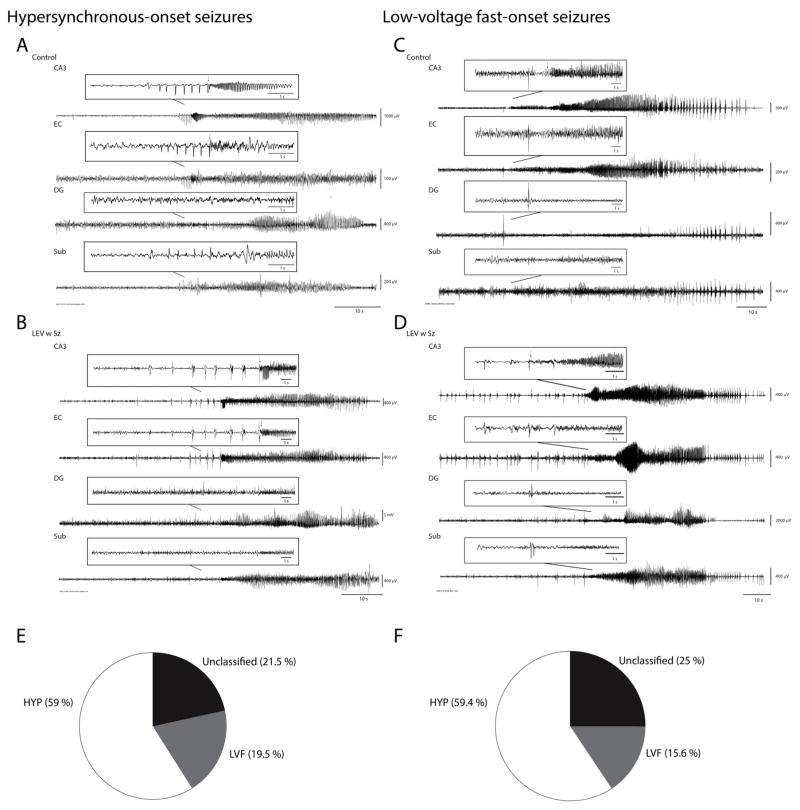
Fig. 2.
(A and B) Representative HYP-onset seizures in a control (A) and in a LEV w Sz animal (B). Note the occurrence of multiple spikes preceding the onset of fast activity (arrow) in CA3, EC and subiculum in the control animal and in CA3 and EC in the LEV w Sz animal. Seizure duration was calculated from the onset of fast activity (15–20 Hz) (arrow) to the end of the seizure. (C and D) Representative LVF-onset seizures in a control (C) and in a LEV w Sz animal (D). Note the occurrence of a single pre-ictal spike preceding the onset of fast activity (arrow). (E and F) Pie chart showing the distribution of seizure-onset patterns in controls (E) and LEV w Sz animals (F). Both groups showed a similar distribution of seizure-onset patterns. CA3, CA3 region of the hippocampus; EC, entorhinal cortex; DG, dentate gyrus; Sub, subiculum.

