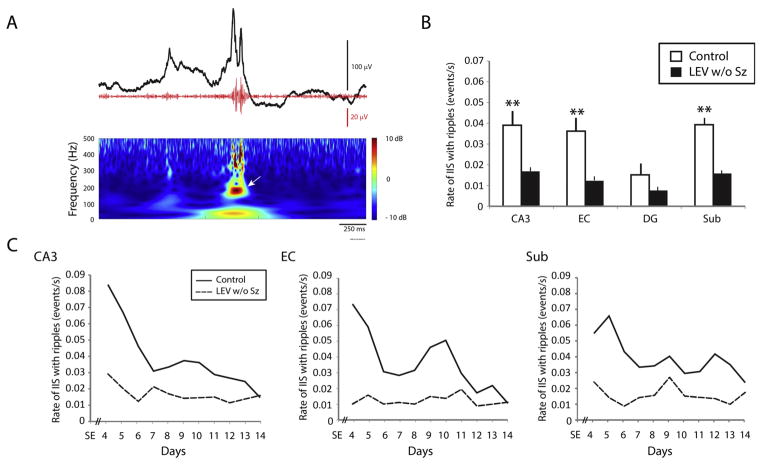
Fig. 4.
(A) Representative example of an interictal spike (black line) co-occurring with a ripple (red line). The time frequency representation of the activity in the ripple frequency range (80–200 Hz) is also shown. The arrow points to the detected ripple. (B) Bar graph showing the average rate of interictal spikes with ripples in each region for the control and the LEV w/o Sz group. In CA3, EC and subiculum, significantly lower rates of interictal spike rates with ripples were recorded (**p < 0.01). (C) Average interictal spike rates over time. Note the difference between controls and LEV w/o Sz animals over time in CA3, EC and subiculum. (For interpretation of the references to colour in this figure legend, the reader is referred to the web version of this article.)

