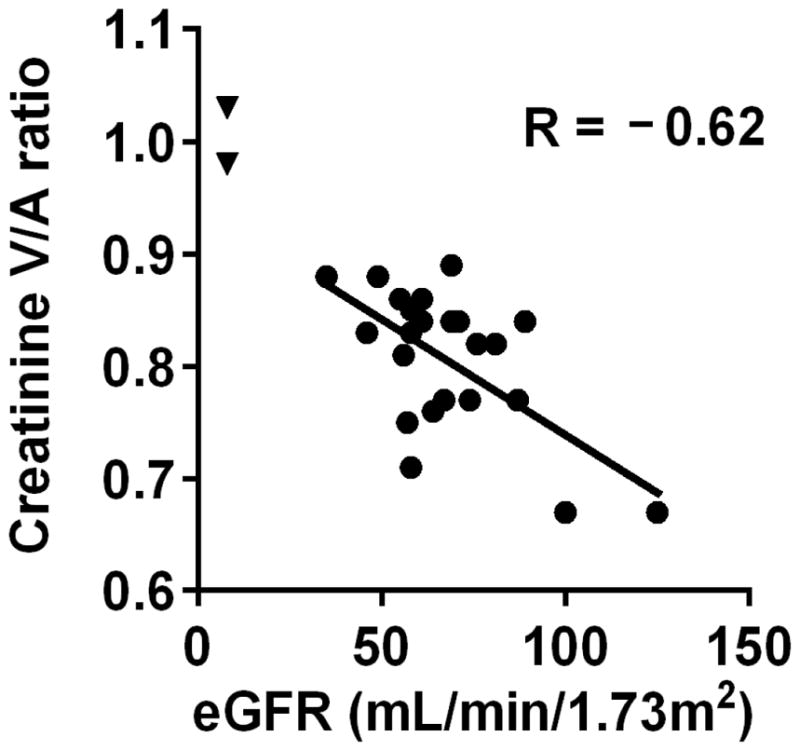
Figure 2. Renal venous to arterial creatinine ratio in 25 individuals.

Each data point represents one individual, with eGFR (estimated by MDRD) plotted on the x-axis and creatinine V/A ratio plotted on the y-axis. The two triangles represent the 2 study subjects with ESRD.
