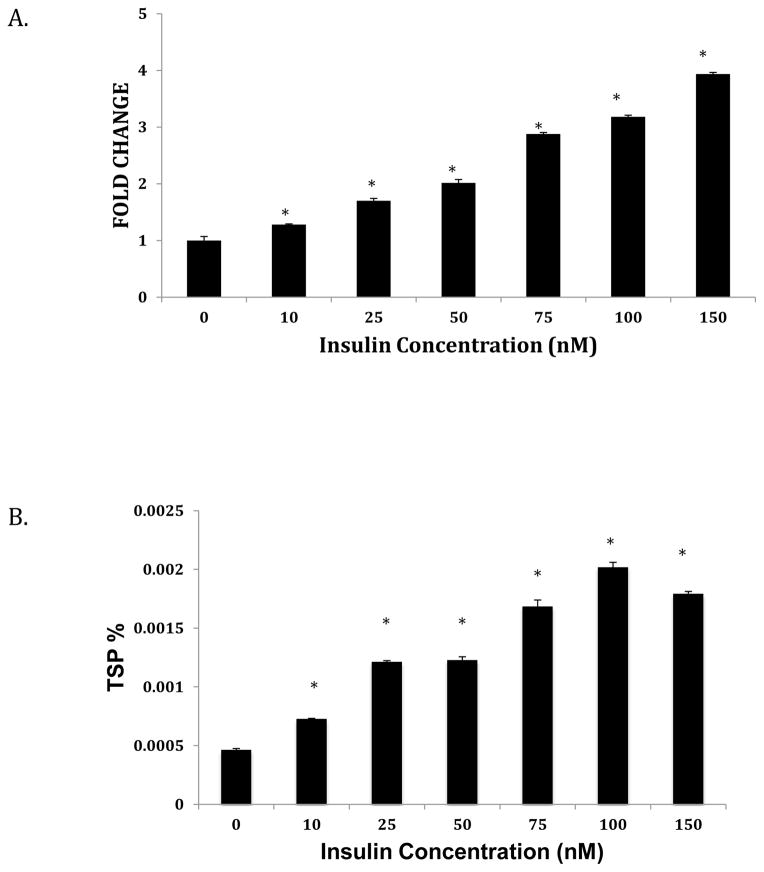
Figure 3. Effect of insulin concentration on ANGPTL8 transcript (A) and protein (B) expression.
Hep G2 Cells were grown to 80% confluence and starved overnight with serum-free media before treatment with varying concentrations of insulin over 12 hours. Total RNA and protein were extracted and expression levels assessed as described in the Methods section. mRNA levels were normalized against ACTB. Protein concentrations are shown as percentage of total soluble protein (TSP). Results represent averages from three independent experiments. Data are shown as means ± standard deviation; a two-tailed t-test was used to determine p-values; *p<0.05.

