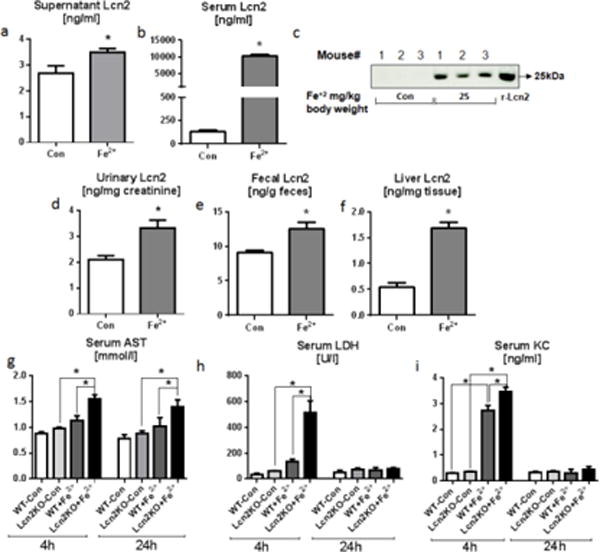
Fig. 1. Iron induces Lcn2 in vitro and in vivo.

For the in vitro studies, bone marrow-derived macrophages (1.0×10⁶ cells/well) were either incubated with or without Fe2+ (100 μM) in triplicates for 6h. a Bar graph represents Lcn2 (ng/ml) level in the supernatants obtained from Fe2+ treated macrophages. For the in vivo studies, six weeks old WT mice (n=4–5) were given either PBS or FeSO4 (25 mg/kg body weight) intraperitoneally. After 24h serum, urine feces and liver were collected for estimating Lcn2 using ELISA and immunoblotting. b–c Bar graph and immunoblot display the Lcn2 level in the serum. d–f Lcn2 level in urine, feces and liver after 24h. Organ damage and inflammation markers were analyzed at both 4h and 24h after FeSO4 (25 mg/kg body weight) administration. g AST, h LDH, and i KC were measured in serum obtained from control and FeSO4 treated Lcn2KO and their WT littermates using commercial kits. Results presented as mean ± SEM. unpaired t-test (a–b, d–f) and Tukey’s post hoc test (g–i) *p< 0.05
