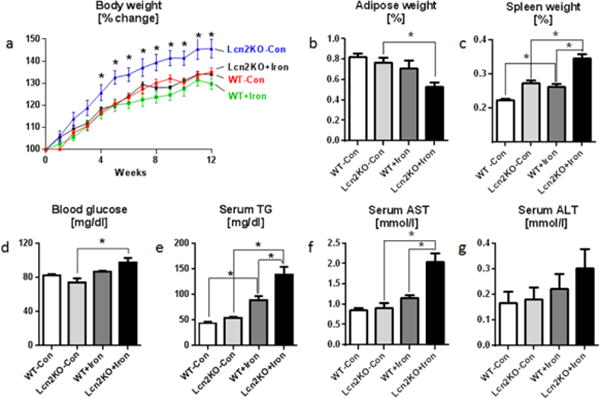
Fig. 2. Lcn2 deficiency potentiates dietary iron-induced toxicity.

Four weeks old male Lcn2KO mice and their WT littermates (n=5) were maintained on 2% carbonyl iron diet for 12 weeks, and monitored for body weight and food intake regularly. Serum, adipose tissue and spleen were collected for analysis. Line graph represents a body weight. Bar graphs represent b adipose tissue weight, c spleen weight, d overnight fasting blood glucose, e serum triglycerides (TG), f serum AST, and g ALT. Results presented as mean ± SEM. unpaired t-test (a, Lcn2KO+Iron to Lcn2KO-Con) and Tukey’s post hoc test (b–g) *p< 0.05
