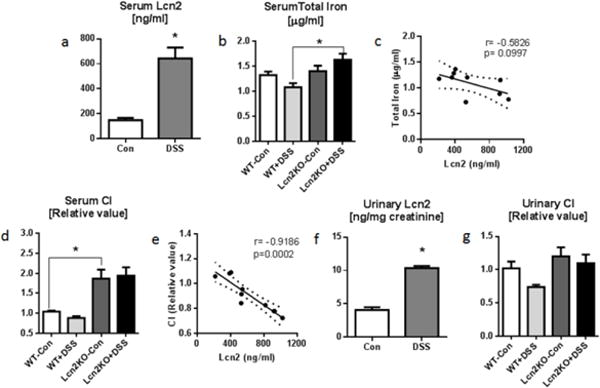
Fig. 4. Lcn2KO mice fail to display hypoferremia during DSS-induced acute colitis.

Eight weeks old male Lcn2KO mice and their WT littermates (n=6–9) were administered 1.8% DSS drinking water for 7 days. Serum and urine were collected on the day of euthanasia for analysis. Bar graphs represent a serum Lcn2 and b serum total iron. c Line graph represents Pearson correlation analysis of serum Lcn2 and serum total iron. d Bar graph represents serum CI. e Line graph shows Pearson correlation analysis of serum Lcn2 and serum CI. f–g Urinary Lcn2 and CI are shown by bar graphs. Pearson correlations between serum Lcn2, total iron and CI were plotted by linear regression (Best-fit line with 95% confidence interval). Results presented as mean ± SEM. unpaired t-test (a, f) and Tukey’s post hoc test (b, d and g). *p< 0.05
