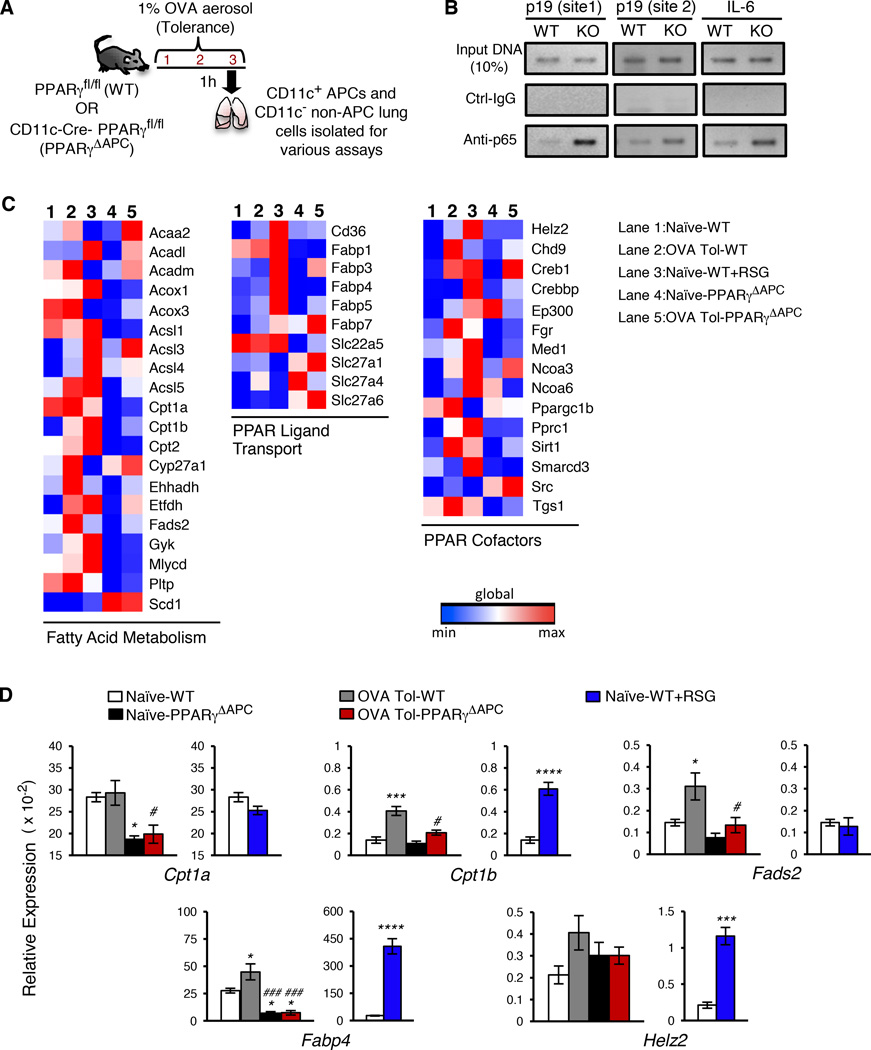
Figure 1. Inhaled antigen-activated PPARγ regulates genes involved in regulation of inflammation and fatty acid metabolism.
(A) Schematic describing the 3-day OVA-exposure protocol for tolerance. (B) ChIP assay of p19 and IL-6 promoters in WT CD11c+ cells sorted from indicated conditions using anti-p65 and control antibodies. (C) Heat map representation of PPAR target array experiments for the indicated genes clustered based on function. mRNA was isolated from CD11c+ cells from naïve (lane 1), tolerized (lane 2), and ex-vivo RSG-treated cells from WT mice (lane 3) and also from naïve (lane 4) and tolerized PPARγΔAPC (lane 5) mice. (D) Graphical representation of relative expression in CD11c+ cells of indicated genes in specific groups present in the PPAR target array. Data shown are mean ± SEM and are representative of two independent experiments (n=3–4 mice/group). One-way ANOVA with Tukey’s post hoc test was used for comparisons between multiple groups: *p< 0.05; ***p< 0.001, ****p< 0.0001 reflect comparisons to expression in naïve PPARγfl/fl and #p< 0.05; ###p< 0.001 correspond to comparisons with OVA tol PPARγfl/fl. See also Figures S1, S2 and S3.

