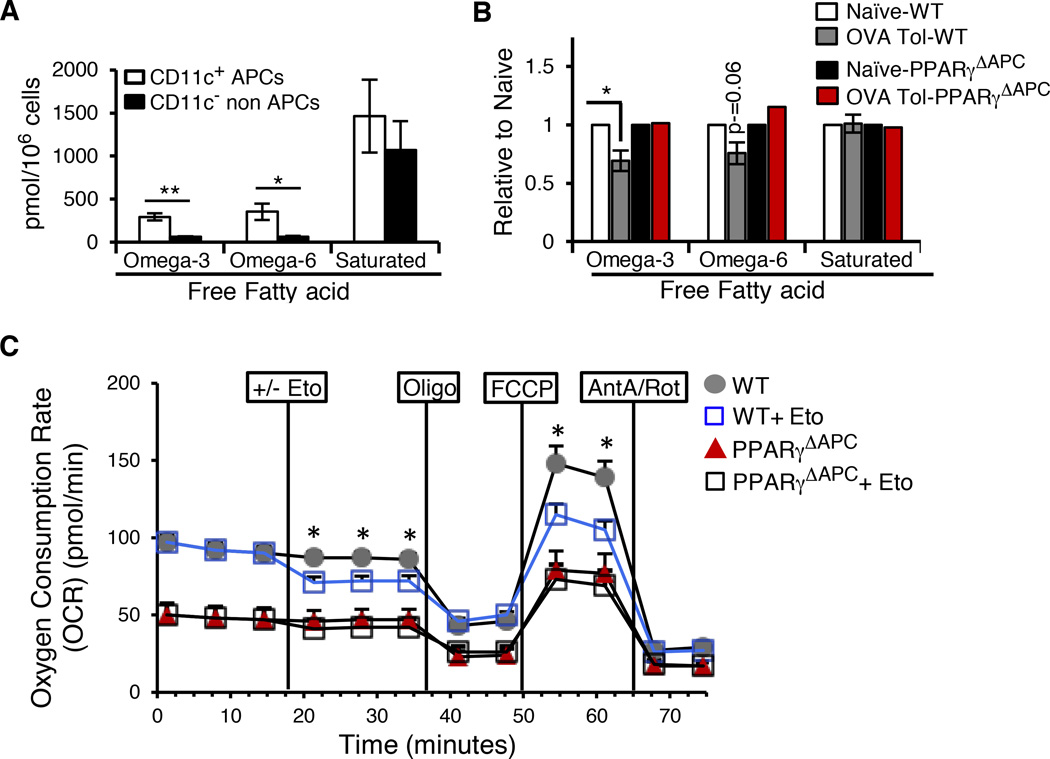
Figure 2. Antigen-activated PPARγ regulates fatty acid metabolism.
(A) Total omega-3, omega-6 and saturated free fatty acid quantification (pmol/106 cells) as estimated by GC/MS analysis performed on CD11c+ APCs and CD11cB220- non-APCs sorted from the lungs of naïve WT mice. Data shown are composite of 3 independent experiments and represent mean values ± SEM. (B) Presence of omega-3, omega-6 and saturated free fatty acids in CD11c+ cells sorted from the lungs of naïve and tolerized WT and PPARγΔAPC mice as observed in 2 independent experiments, expressed as fold change (relative to naïve of the respective strain). Data shown are composite of 2 independent experiments and represent mean values ± SD. (C) OCR of CD11c+ cells isolated from tolerized WT and PPARγΔAPC mice was measured at the basal level and then after-sequential treatment with DMEM/200 µM Etomoxir (Eto) followed by 1 µM oligomycin (Oligo), 1.5 µM FCCP, and 0.1 µM rotenone plus 1 µM antimycin (Ant A+Rot) using the XF-96 Seahorse system. The assay is representative of 2 independent experiments, run in triplicates and shown as mean values ± SEM *p< 0.05, **p< 0.01.

