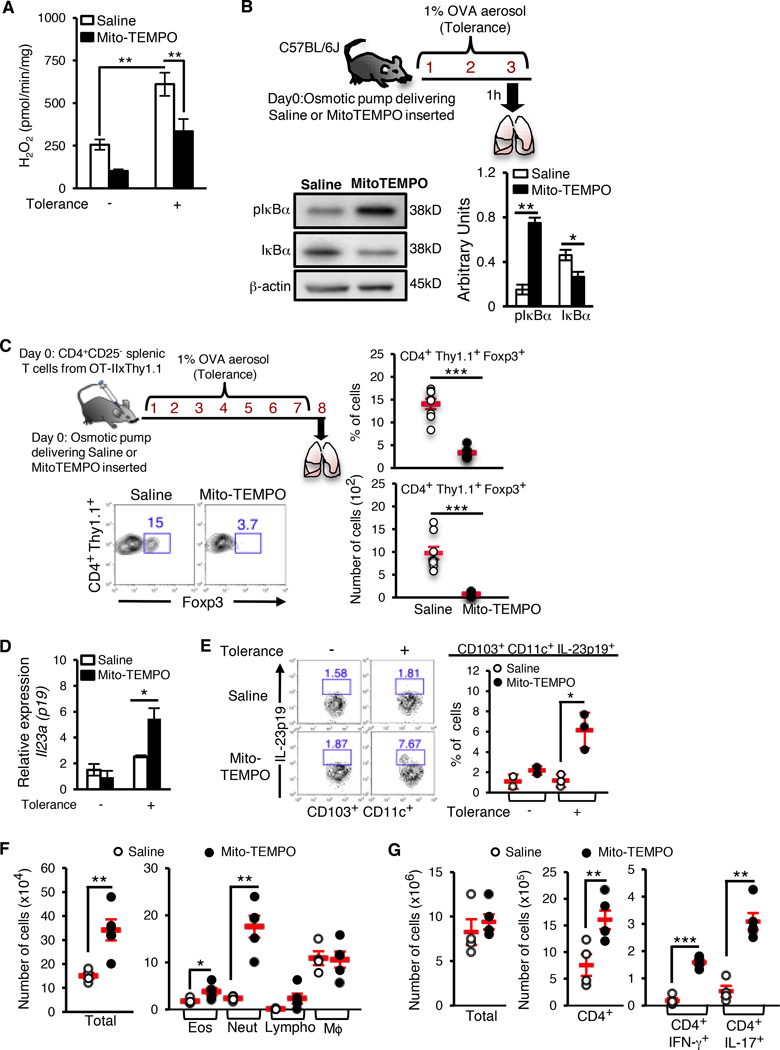
Figure 6. Absence of PPARγ-dependent mitochondrial ROS generation in CD11c+ cells induces a Th17 immune response.
Osmotic pumps delivering either saline or Mito-TEMPO (0.7 mg/kg/day) were surgically inserted in C57/BL6J mice that were then exposed to inhaled OVA (as indicated). (A) Amplex red assay was used to quantitate H2O2 generation in sorted lung CD11c+ cells. Combined data from two independent experiments expressed as mean ± SEM. (B) Representative western blot and densitometry quantification to detect expression of pIκBα and total IκBα levels in lung CD11c+ cells. (C) 106 CD4+ CD25− splenic T cells from OT-IIxThy1.1 mice were adoptively transferred following osmotic pump implantation. The recipient mice were exposed to inhaled OVA (upper left panel) and Foxp3 induction in the donor T cells in the lungs of the recipient mice was assessed. Representative flow cytometry data from one of two experiments (bottom left) and frequency (top right) and number (bottom right) of CD4+ Thy1.1+ Foxp3+ T cells are shown. Symbols in the graphs represent individual mice (n=6), horizontal lines show the mean values and error bars denote SEM. (D) Expression of Il23a (p19) mRNA in CD103+ CD11c+ lung cells sorted from naïve and tolerized saline- or Mito-TEMPO-treated mice, relative to hprt1. (E) Flow cytometry analysis (left) and frequency (right) of IL-23p19-expressing lung CD103+CD11c+ cells from naïve and tolerized saline- or Mito-TEMPO-treated mice. Symbols in the graphs represent individual mice (n=3), horizontal lines show the mean values and error bars denote SEM. (F–G) Following osmotic pump implantation, mice were tolerized to OVA and tested for induction of tolerance as described under methods. 24 hr after the last treatment, various parameters of inflammation were analyzed. (F) Total cell numbers (left), and eosinophils and neutrophils (right) in the BAL fluid, and (G) Number of total lung cells, CD4+ T cells and IL-17A+ and IFN-γ+ CD4+ T cells in the lungs of saline- or Mito-TEMPO-treated mice were enumerated. Symbols in the graphs represent individual mice (n=5), horizontal lines show the mean values and error bars denote SEM. *p< 0.05, **p< 0.01, ***p< 0.001.

