
Figure 3. Mouse tibial cyclic compression model and localized cartilage thickness after cyclic compressive loading in adult mice.
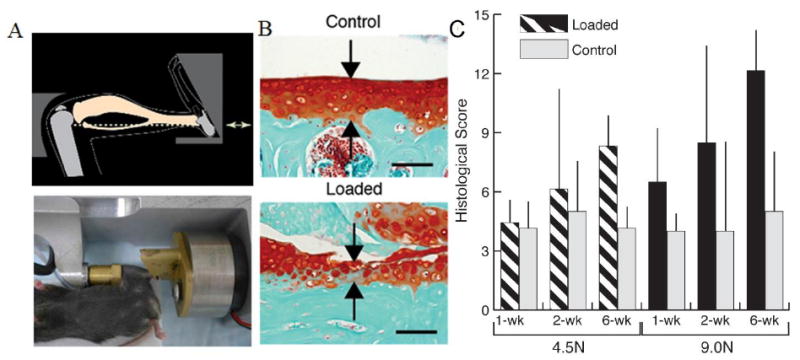
A) Mouse positioned in loading device, ready for in vivo axial loading to be applied to the left tibia. B) Safranin O–fast green staining of the nonloaded contralateral limb and loaded limb (peak load 9.0N) show the thickness of the cartilage (red, arrows) after 6 wks of mechanical loading in the posterior aspects of the lateral tibial plateau. Bars = 100 μm. C) Loading increased histological scores of cartilage degeneration in adult mice compared to controls, and the load-induced damage increases depending on the load level and duration. Bars show the mean ± SD of 42 adult mice. P < 0.05 by repeated-measures two-way analysis of variance (young mice) or three-way analysis of variance (adult mice) for comparisons of the effects of loading, duration, loading × duration, and loading × load level. Adapted with permission from Ko et al. 33.