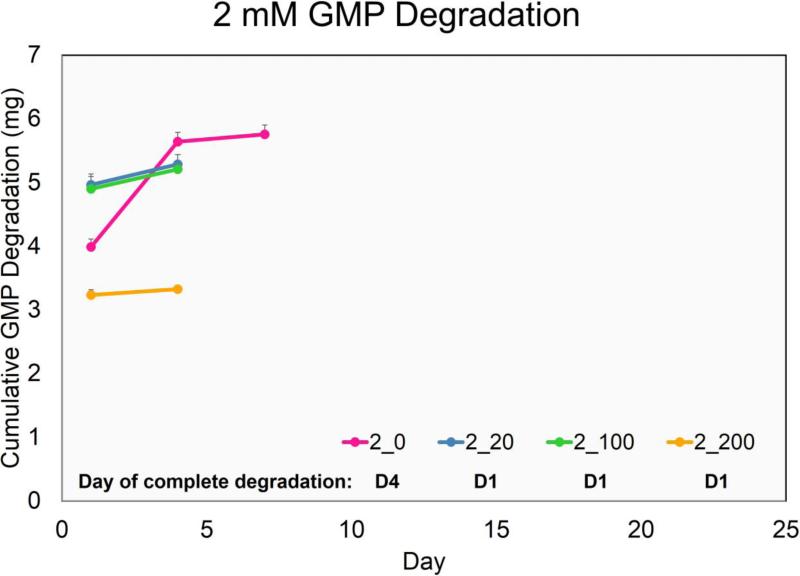
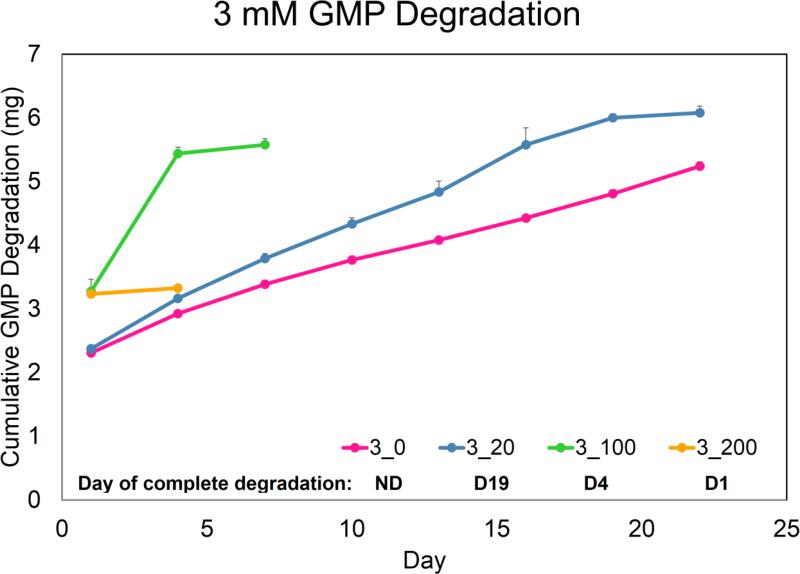
Figure 1.
Degradation profile of GMPs crosslinked with a 2mM (A), 3mM (B), 4mM (C), and 5mM (D) glutaraldehyde solution. Cumulative degradation of GMPs was measured up to 35 days in collagenase-containing PBS. 2_0, 2_20, 2_100, and 2_200 designate 2 mM GMPs incubated with PBS containing 0, 20, 100, or 200 ng/mL collagenase 1A, respectively. Similar shorthand designations apply for 3mM, 4mM, and 5mM GMPs. The day of complete degradation is stated and is indicated by a slight plateau in the cumulative GMP degradation graph. GMPs that did not degrade within the culture period are denoted with an ND. Error bars correspond to standard deviation for n=3 samples.


