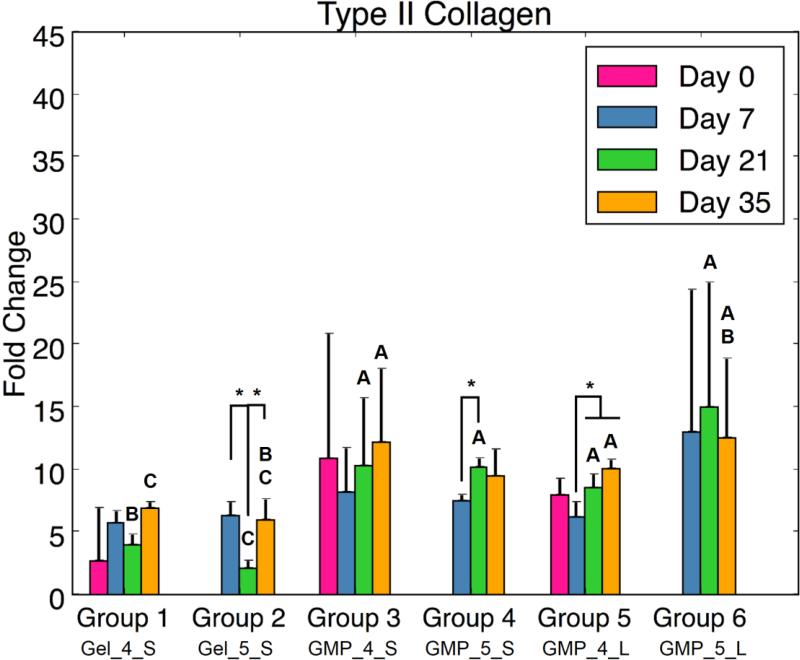
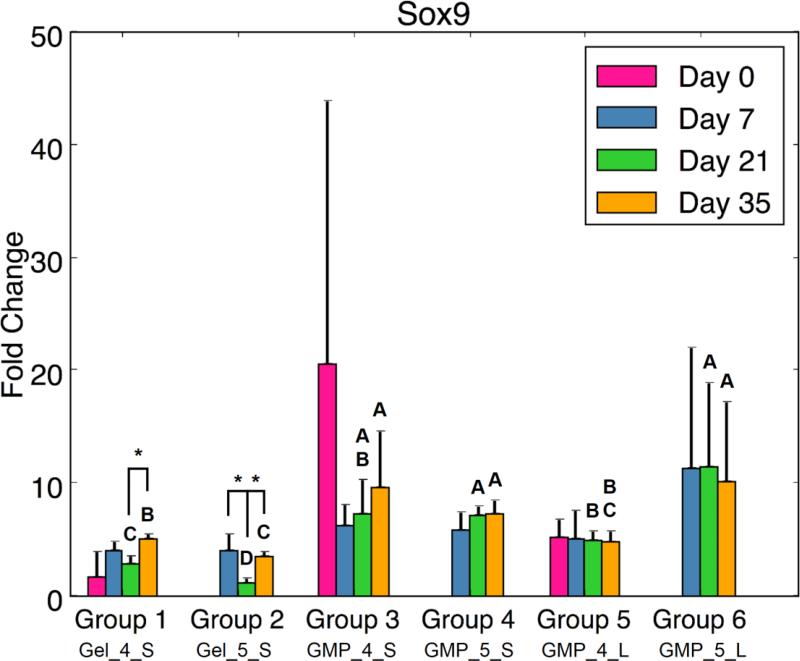
Figure 5.
(A) Type II Collagen expression, (B) Aggrecan expression, and (C) Sox9 expression for each experimental group at various time points. At each time point, groups connected with different letters are significantly different (p < 0.05). Within each group, time points connected by lines and noted with (*) are significantly different. The x-axis labels are denoted by Gel or GMP, representing MSCs co-encapsulated with GMPs vs seeded on GMPs; 4 or 5, representing the crosslinking extent of GMPs at either 4mM vs 5mM; and S or L, representing smaller 50-100μm GMPs vs larger 100-150μm GMPs. Error bars correspond to standard deviation for n=4 samples.


