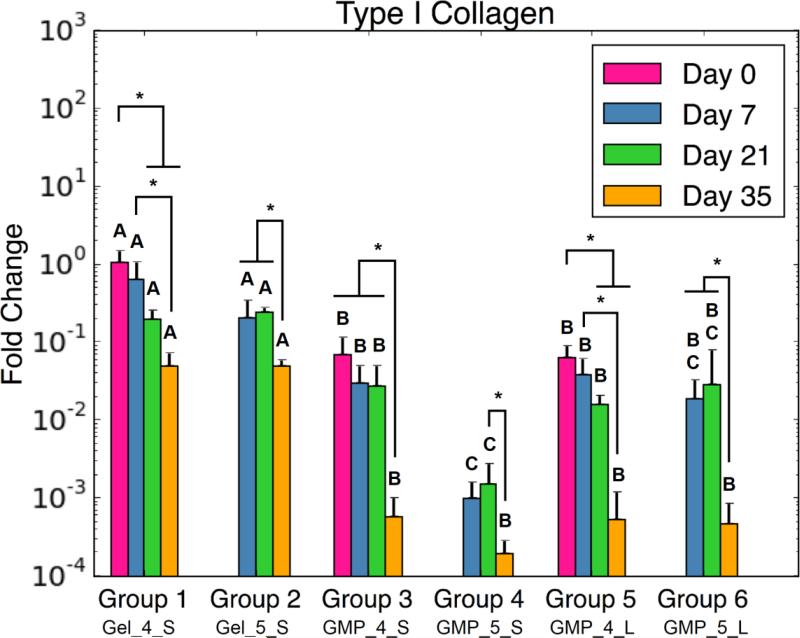
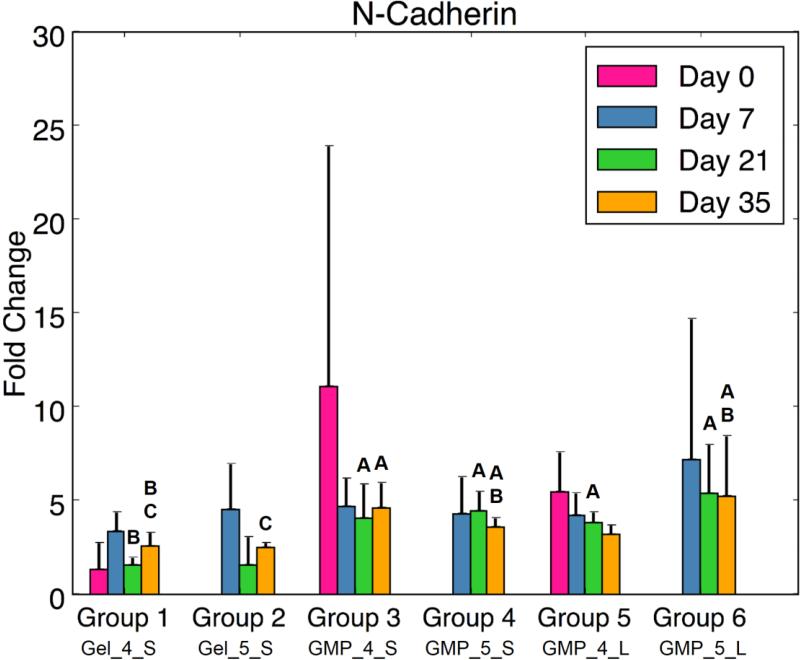
Figure 6.
(A) Type I Collagen, (B) Runx2, and (C) N-Cadherin expression for each experimental group at various time points. At each time point, groups connected with different letters are significantly different (p < 0.05). Within each group, time points connected by lines and noted with (*) are significantly different. The x-axis labels are denoted by Gel or GMP, representing MSCs co-encapsulated with GMPs vs seeded on GMPs; 4 or 5, representing the crosslinking extent of GMPs at either 4mM vs 5mM; and S or L, representing smaller 50-100μm GMPs vs larger 100-150μm GMPs. Error bars correspond to standard deviation for n=4 samples.


