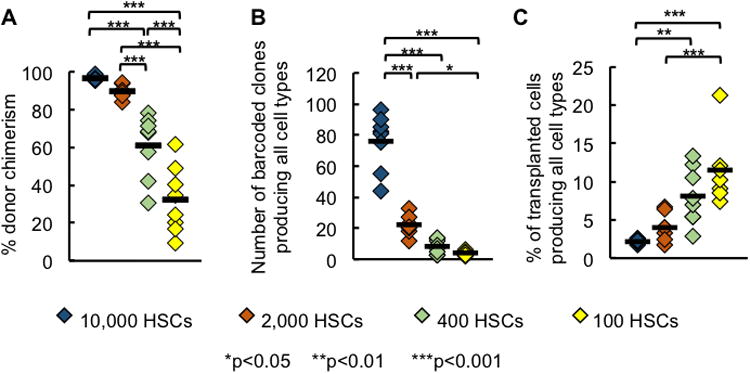
Figure 1. More Donor HSCs Engraft and Produce Every Cell Type at High Transplantation Doses.

(A) Granulocyte donor chimerism at each transplantation dose.
(B) Number of barcoded clones that produced every measured cell type (granulocytes, B cells, CD4 T and CD8 T cells) at each HSC transplantation dose.
(C) Percentage of transplanted clones that produced every measured cell type at each HSC transplantation dose. Data in Figure 1B was divided by the number of transplanted HSCs that carry barcodes as shown by GFP expression.
Each diamond represents one mouse; horizontal black lines represent group means. All data were collected six months post transplantation. 7-8 mice were used per transplantation dose.
