
Figure 2. High HSC Doses Increase the Number of Early Differentiating Clones.
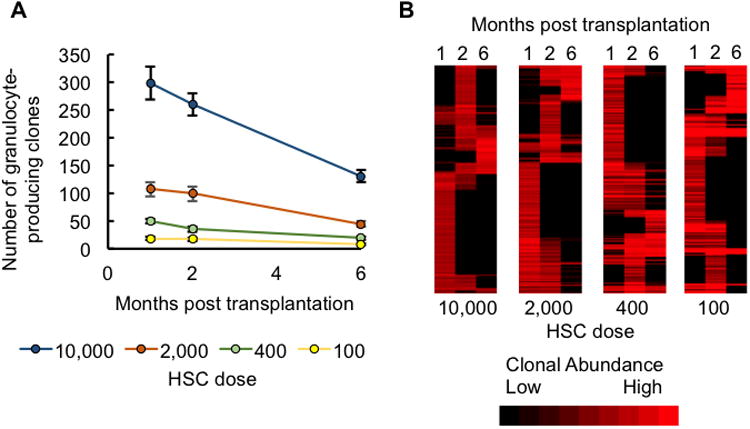
(A) The number of clones that produced granulocytes at one, two, and six months post transplantation. Data points represent group means. Error bars represent standard error of the mean. See Table S1 for significance values.
(B) A heatmap depicting granulocyte production by individual HSC clones at one, two, and six months post transplantation. Clones from all examined mice at each transplantation dose are shown. The presence of a red band in a column represents granulocyte production by an HSC clone at that time point. A red band stretching across multiple columns represents an HSC clone producing granulocytes at multiple time points. Bright red bands represent high levels of granulocyte production. Black represents the lack of granulocyte production by an HSC clone at that time point. Clones are clustered based on the similarity of their granulocyte production over time. There were 7-8 mice per dose group.