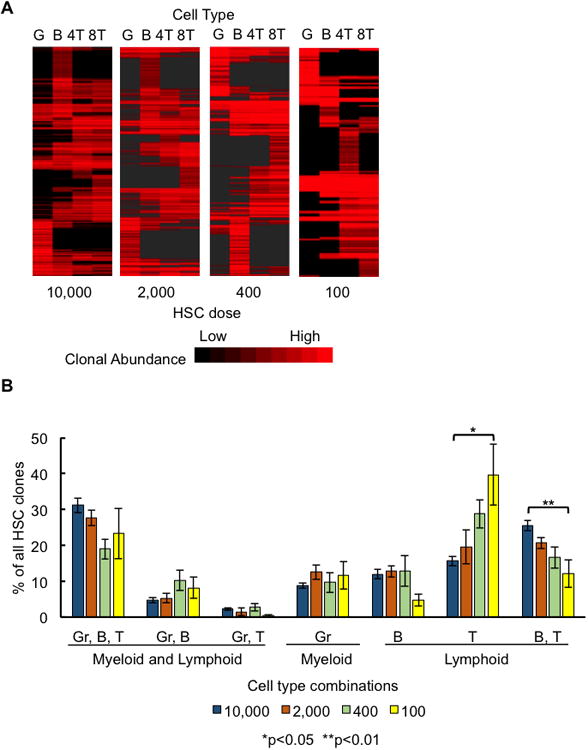
Figure 3. Most Long-Term Clones Do Not Produce Every Blood Cell Type.

(A) A heatmap depicting the production of granulocytes, B cells, CD4T, and CD8T cells by individual HSC clones. Clones from all examined mice at each transplantation dose are shown. A red band in a column represents an HSC clone producing that specific cell type. A red band stretching across multiple columns represents an HSC clone producing multiple cell types. Bright red bands indicate high levels of blood cell production. Black represents the lack of production of that cell type by an HSC clone. Clones are clustered based on the similarity of their white blood cell production six months after transplantation.
(B) Clones were categorized by the combination of cell types they produced six months post transplantation. All possible combinations of measured cell types are displayed in the graph. A clone was considered to produce T cells if CD4T and/or CD8T cells were detected among its progeny. Bar graphs display the percentage of clones belonging to that category. Percentages were calculated separately for each mouse and then averaged across each HSC dose group. Error bars represent standard error of the mean. 7-8 mice were used per transplantation dose.
