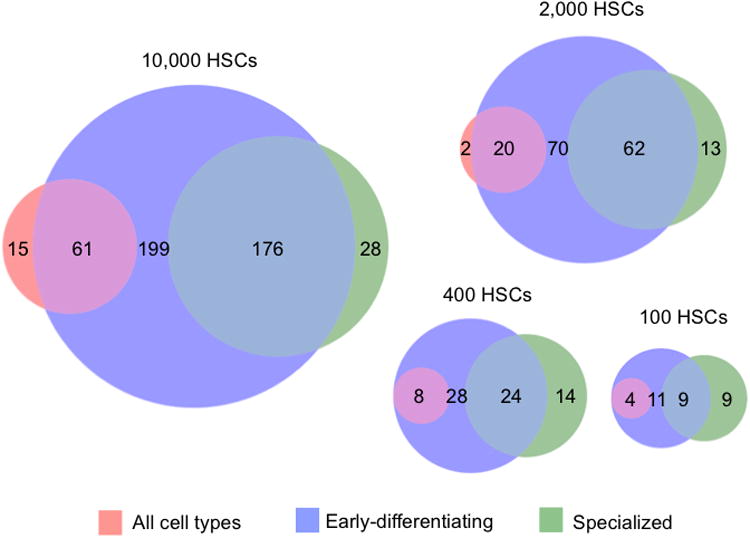
Figure 4. HSC Clones Exhibit Various Differentiation and Temporal Patterns.

Clones were categorized as “early-differentiating” (produced granulocytes one and/or two months post transplantation), “all cell types” (produced every measured cell type six months post transplantation), and/or “specialized” (did not produce every measured cell type six months post transplantation). The Venn diagrams show the size and overlap of these three categories of clones at each HSC transplantation dose. Numbers represent the mean clone counts for each category by HSC dose. See also Tables S2-S3 for significance values. 7-8 mice were used per transplantation dose.
