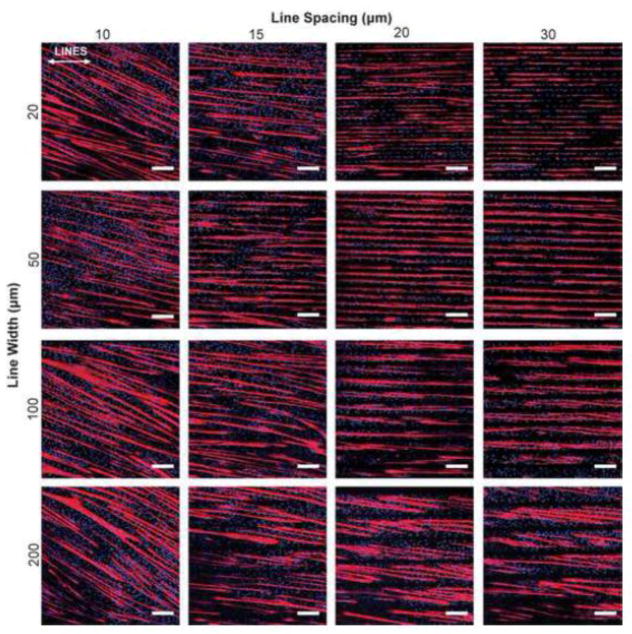
Figure 3.
Representative images of C2C12 cells differentiated on 16 different line patterns of LAM. Myotubes deviate from aligning with the designated pattern when geometric spacing is too narrow (<15 μm), or when the lines are too wide (200 μm). White arrows represent direction of μCP lines. Scale bars 200 μm. Blue – DAPI; Red – MHC.

