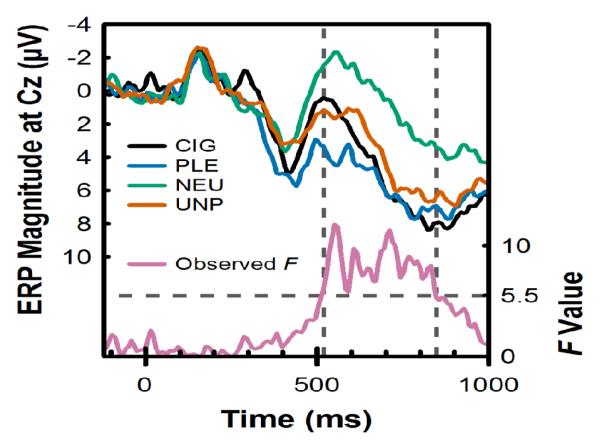
Figure 1.
The time window for computing the LPP was identified via permutation testing. Upper traces, left vertical axis: Grand-average event-related potential (ERP) at Cz in response to cigarette-related (CIG), pleasant (PLE), neutral (NEU), and unpleasant (UNP) pictures. Time is plotted on the horizontal axis, where stimulus onset occurred at 0 ms. Lower trace (Observed F), right vertical axis: F-statistic for the effect of picture category observed at each time point. The dashed horizontal line indicates the threshold for identifying time points with significant effects of picture category. This value (F > 5.5) was obtained using a permutation-based statistical testing approach (for details, see Statistical Analysis). The dashed vertical lines illustrate the time window (520-848 ms) used to compute the LPP magnitude.

