
Figure 2. Mean Annual Prescription Drug Costs from Year 0 to 15 (Years 0–6: Questionnaire data; Years 7–15: Register data from the Prescribed Drug Register, data capture 2005–2013).
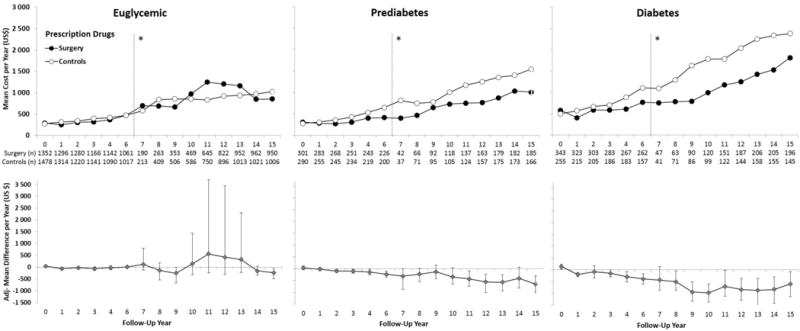
Adjusted for baseline age, sex, smoking, body mass index and inclusion period (</≥ 1995), and drug costs the year prior to the index date (year 0). Error bars indicate 95%CIs derived by nonparametric bootstrapping. Data were not collected in year 5 and therefore no data are presented. Results are based on observed data. Imputed vs observed data are shown in eFigure 2. *Self-reported drug data collected for follow-up years 0–6 (left) and Swedish Prescribed Drug Register data for follow-up years 7–15 (2005–2013) (right). Costs are reported in 2013 US$.