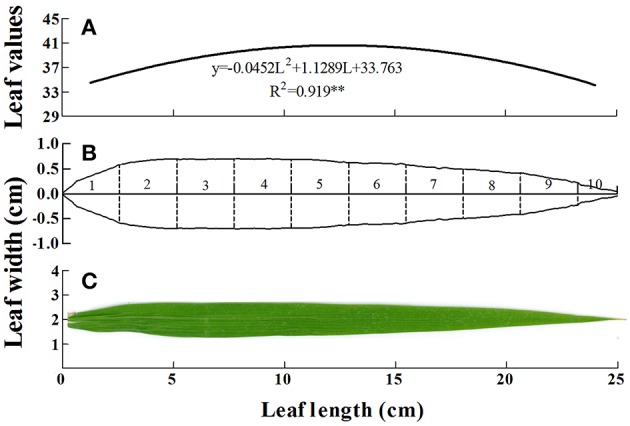
Figure 3.

Leaf characters under light N deficiency (150 kg N ha−1) at panicle initiation stage in rice. (A) The dynamic chlorophyll concentration along the leaf blade can be described by a quadratic regression. **significant at p < 0.01. The analysis was performed by least-squares method with IBM SPSS version 21.0 software. (B) Leaf shapes were digitalized by Engauge Digitizing software (http://digitizer.Sourceforge.net/). Numbers 1–10 represent ten equal parts of the leaf based on leaf length, which will facilitate the calculation of each part's actual area by calculus method. (C) The real leaf blade of rice, from which diagram (B) was mapped.
