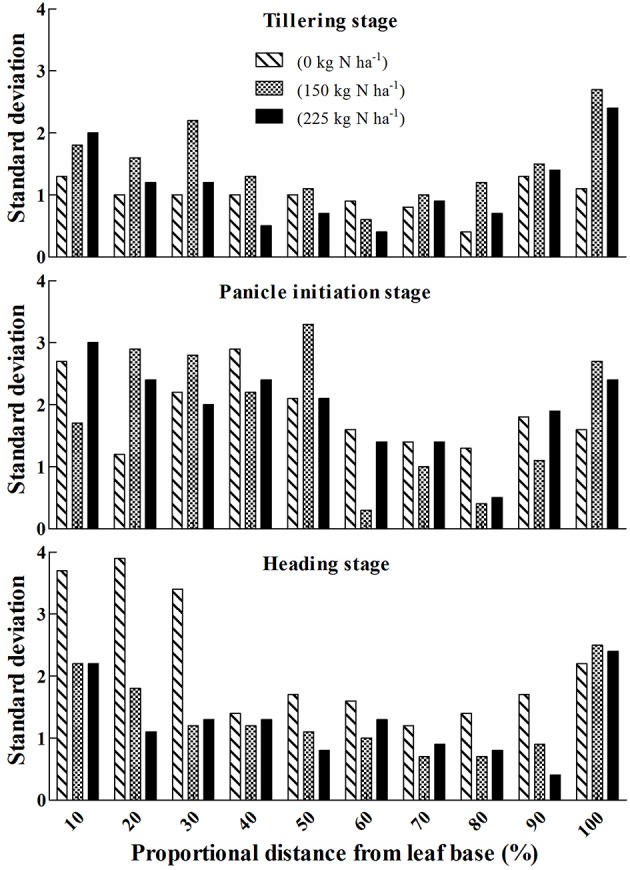
Figure 4.

Variation of SPAD values based on red scanner band along the leaf blade of rice under three N rates (0, 150, 225 kg N ha−1) at different growth stages. Y axis is the standard deviation of absolute SPAD values, which is consistent with Figures 2A–C. Absolute SPAD values were calculated by Equation (5), in which red scanner band value is the input variable.
