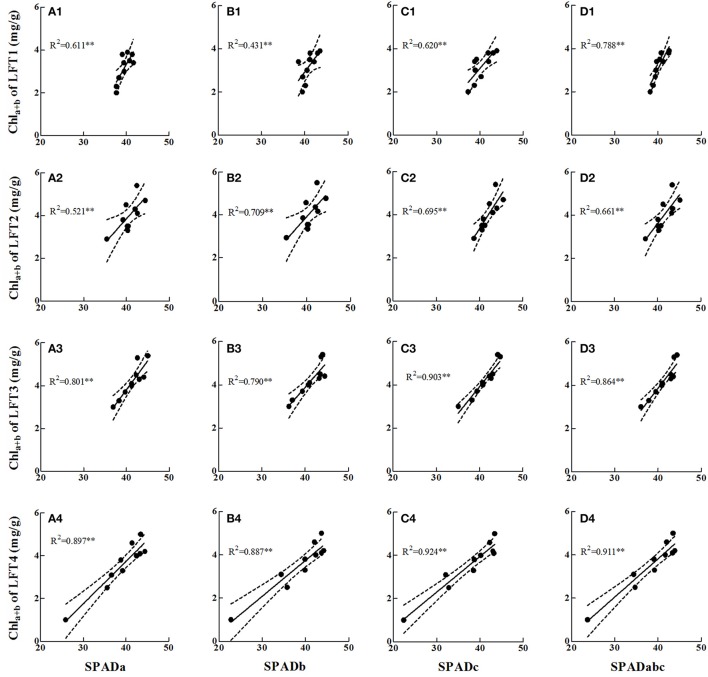
Figure 6.
Relationships between di-positional SPAD readings and chlorophyll concentration (Chla+b) at panicle initiation growth stage. Di-positional SPAD readings were regressed with chlorophyll concentration of LFT1 (A1–D1), LFT2 (A2–D2), LFT3 (A3–D3), and LFT4 (A4–D4). LFT1-4 represent the first, second, third, and fourth fully expanded leaf from top. SPADa, SPADb and SPADc are the SPAD readings detected at the 1/3, 1/2, and 2/3 of the distance from the leaf base, respectively. SAPDabc is the average values of SPADa, SPADb and SPADc. **significant at p < 0.01. The solid line denotes the linear regression and the dotted lines represent the confidence bands (p = 0.95). The analysis was performed by least-squares method with IBM SPSS version 21.0 software.

