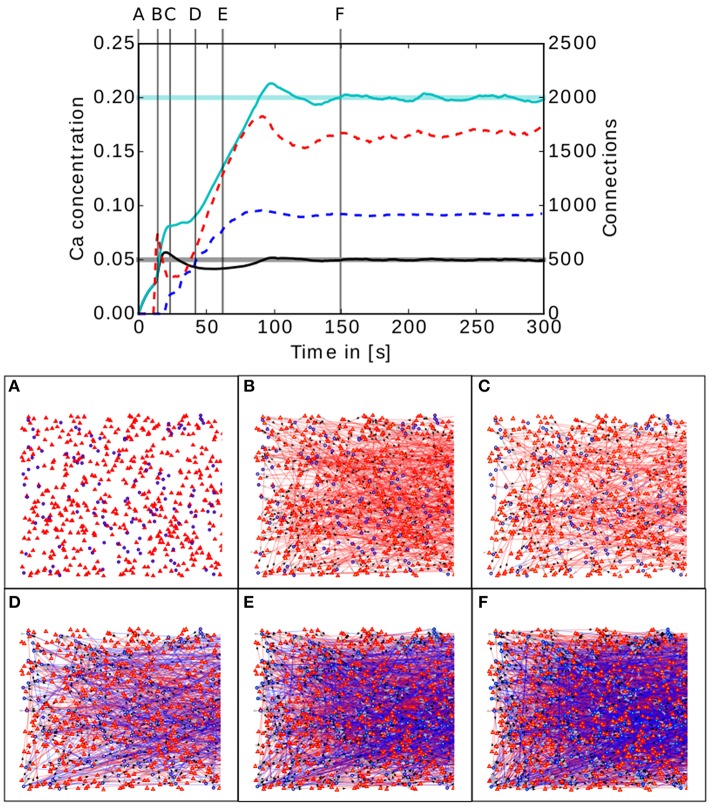
Figure 5.
Upper panel: Calcium concentration and numbers of connections as functions of time in a simple two population network. The cyan and black curves show the calcium concentration measured in the inhibitory and excitatory populations, respectively. The paler horizontal lines indicate the corresponding target levels ϵ. The blue and red dashed curves indicate the total number of connections in the inhibitory and excitatory populations, respectively. Vertical gray lines indicate the times of the snapshots displayed in the lower panel. Lower panel (A–F): Evolution of the connectivity in the two population network visualized using MSPViz. Images show half of the total amount of neurons in the network, where triangles represent excitatory neurons and circles inhibitory neurons. Red lines indicate excitatory connections while blue lines indicate inhibitory connections.

