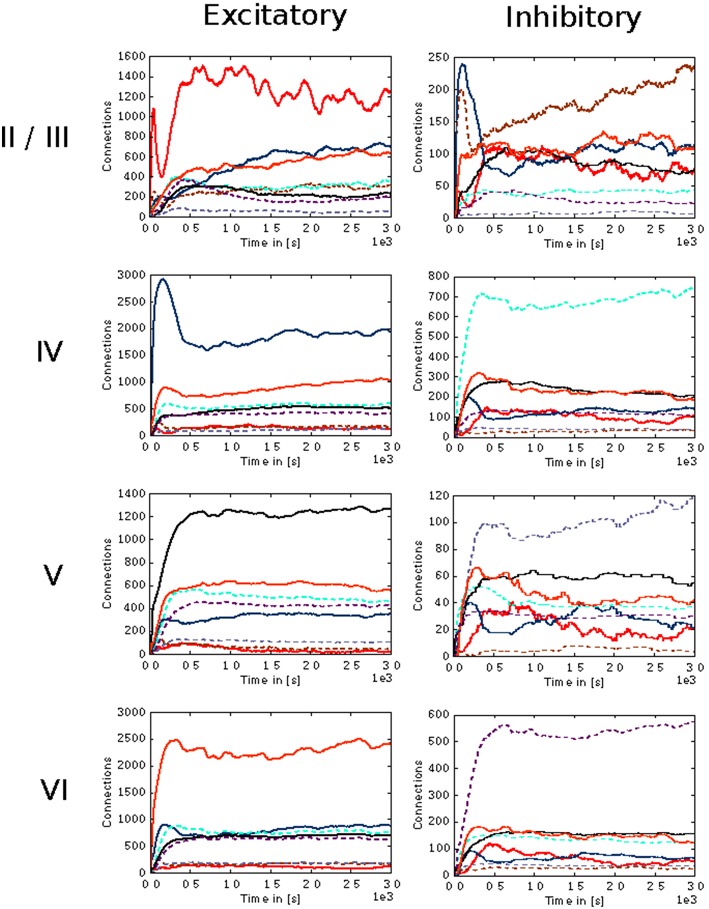
Figure 7.
Evolution of connectivity in the microcircuit model resolved by source and target population. Panels on the left and right illustrate efferent connections from excitatory and inhibitory populations, respectively, while the vertical arrangement indicates the layer of the source neurons. In each panel, the numbers of connections to each of the eight population in the model are shown as a function of time. The color of the curves indicates the target population, as in Figure 6: connections to excitatory populations in layers II/III (red), IV (blue), V (black), and VI (orange) are shown as solid curves, and connections to inhibitory populations in layers II/III (brown), IV (cyan), V (gray), and VI (purple) are shown as dashed curves.

