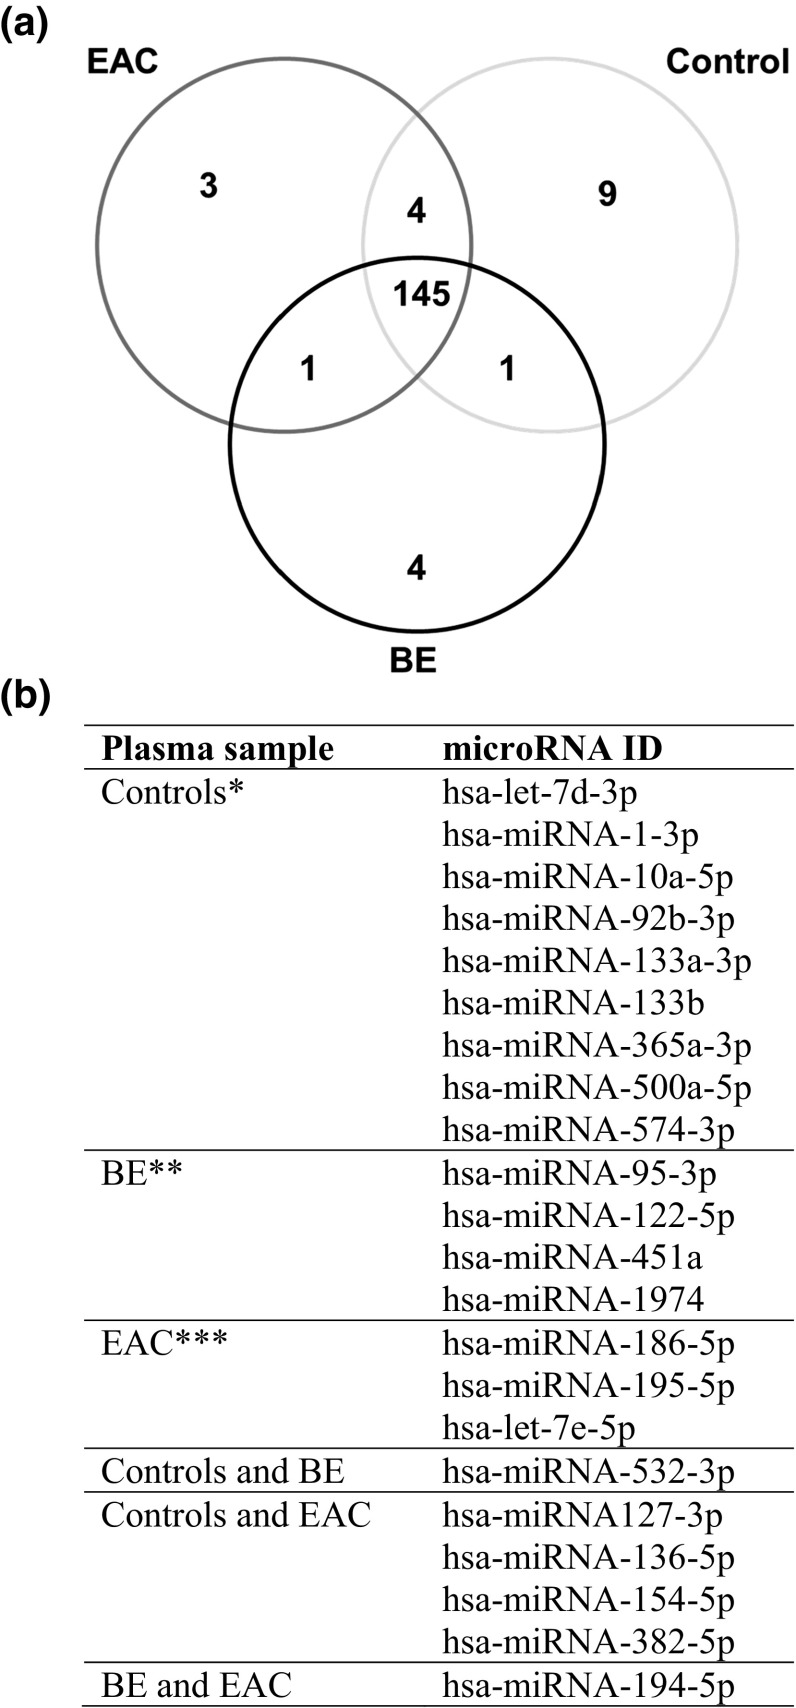
Fig. 1.
Venn diagram of circulating microRNAs in esophageal adenocarcinoma, Barrett’s esophagus, and normal controls; profiling study. Venn diagram showing the distribution of microRNA expression comparing plasma samples from controls, patients with BE Barrett’s esophagus, and EAC esophageal adenocarcinoma. a Depicted are all miRNAs significantly differentially expressed or more than 1.5-fold up- or down-regulated comparing the various groups. b Shows the specific microRNAs depicted in the Venn diagram

