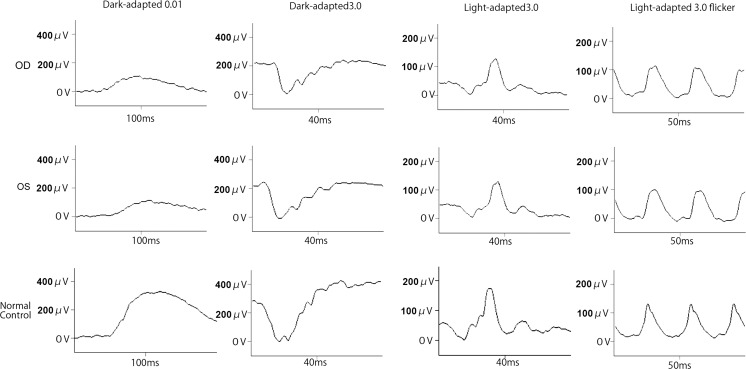
Fig. 2.
Full-field electroretinograms (ERGs). Full-field ERGs recorded from the right eye (top) and left eye (middle) of the proband (II-1) are shown. The ERGs recorded from a normal control are also shown (bottom). The dark-adapted 0.01, dark-adapted 3.0, light-adapted 3.0, and light-adapted 3.0 flicker ERGs are shown. The results of all the responses show a slight reduction of the b-wave amplitudes in both eyes

