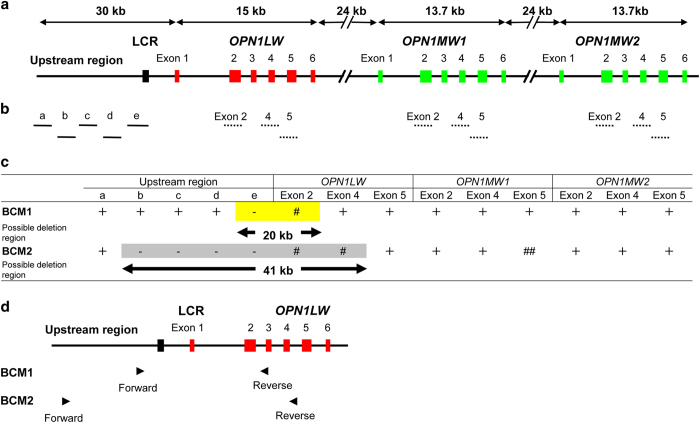
Figure 2.
Gross determination of the deletion region in two Japanese families with blue cone monochromacy (BCM). (a) Genome structure of human OPN1LW and OPN1MWs. Red and green boxes represent OPN1LW and OPN1MWs exons, respectively; the black box represents the locus control region (LCR). (b) Target positions for examining the existence of each region; solid and broken lines represent unique and coexisting genomic regions, respectively. Each line was drawn along the same scale and position with the upper panel (Figure 2a). Exons 2, 4 and 5 were examined because they differ between OPN1LW and OPN1MWs. Furthermore, only exon 5 could be distinguished between OPN1MW1 and OPN1MW2. Because other exons (exons 1, 3 and 6) had the same sequence in these genes, they were only examined for possible small-scale sequence alterations, including point mutations (Supplementary Table). No such mutations were detected (see text). (c) Summary of PCR analysis of each region. +, PCR product was amplified from patients' DNA and confirmed as OPN1LW or OPN1MW; −, PCR product was not amplified from patients' DNA; #, PCR product was amplified from patients' DNA, but sequences representing OPN1LW exons were absent; ##, PCR product was amplified from patients' DNA, but sequences representing the OPN1MW1 exon was absent. In BCM1, the deletion size was estimated to be ~20 kb (yellow background). In BCM2, the deletion size was estimated to be 41 kb (gray background). The existence of exons 2 and 4 of OPN1MW1 and/or OPN1MW2 as well as exon 5 s of OPN1LW and OPN1MW2 suggested an additional complicated genomic rearrangement (see text). (d) Primer positions for junction PCR. Genomic structure of human OPN1LW. Red and black boxes represent OPN1LW exons and LCR, respectively. Solid arrowheads indicate forward and reverse primers used for junction PCR. The primers had the following sequences: BCM1, 5′- CACATGCGGGTGCCACTACA-3′ and 5′- TCCCTATGGGGAGAGCAGAC-3′; and BCM2, 5′- CTGCCCTGAAGAGAGAGGCT-3′ and 5′- GACCCAGGCATAGGGAGTTG-3′.

