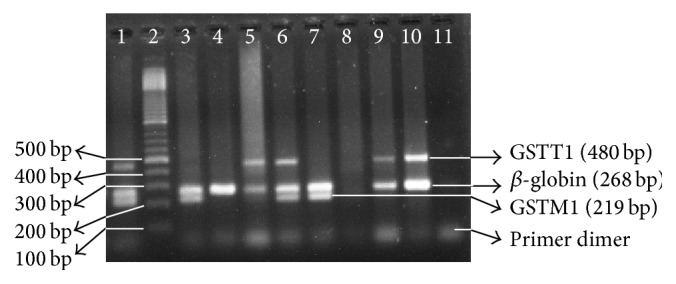
Figure 1.

Agarose gel electrophoresis showing the genotypes of GSTM1 and GSTT1 genes. The presence or absence of GSTM1 and GSTT1 genes was detected by the presence of a band at 219 bp (corresponding to GSTM1) and a band at 480 bp (corresponding to GSTT1). The bands at lane 2 indicate molecular marker of 100 bp DNA ladder. A band at 268 bp (corresponding to β-globin gene) was always present and was used as internal control to document successful PCR amplification. Lanes 1 and 6 indicate individuals with the presence of both GSTM1 and GSTT1 alleles (+/+). Lane 4 represents an individual with null alleles for both GSTM1 and GSTT1 genes (−/−) showing only one band at 268 bp corresponding to the internal control (β-globin gene fragment). Lanes 3 and 7 represent presence of GSTM1 allele and absence of GSTT1 allele (GSTT1 null allele, +/−). Lane 8 is negative control. Lanes 9 and 10 correspond to the individuals with GSTM1 null and GSTT1 present (480 bp) alleles (−/+). The bands at the bottom of the gel are due to the formation of dimer by the primers.
