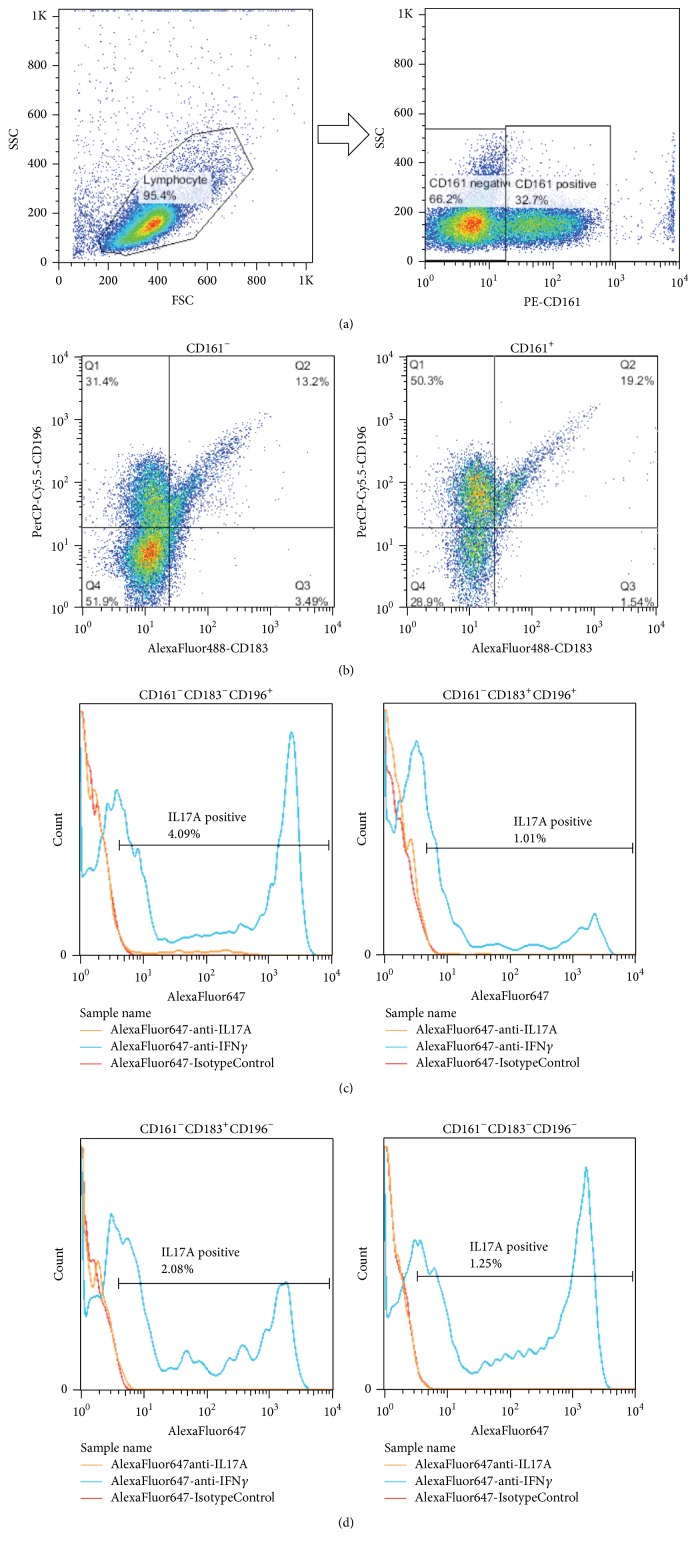
Figure 1.
Representative flow cytometry gating and histograms of CD161 negative cells. (a) Separation of CD161 positive cells. (b) Four subsets of CD161 negative or positive cells. (c) Histograms of CD161 negative cells. CD183−CD196+ cells (Th17) (left) and CD183+CD196+ cells (right). Orange lines: IL-17; blue lines: IFNγ; and red lines: control. (d) Histograms of CD161 negative cells. CD183+CD196− cells (Th1) (left) and CD183−CD196− cells (right). Orange lines: IL-17; blue lines: IFNγ; and red lines: control.

