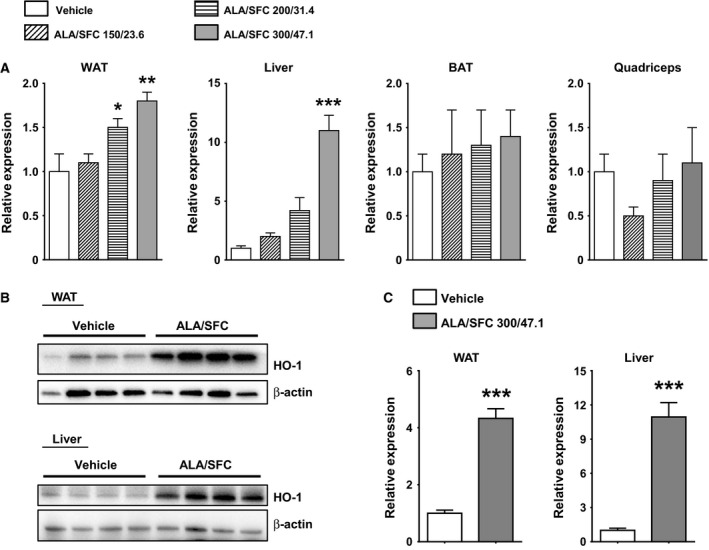
Figure 7.

Expression levels of HO‐1 in various tissues of ZDF rats administered ALA/SFC. (A) Expression levels of HO‐1 mRNA in tissues after 6‐week administration of ALA/SFC. The expression levels are shown as values relative to those of the vehicle‐administered group (Set to 1.0). *P < 0.05, **P < 0.01, ***P < 0.001 vs the vehicle‐administered group (Tukey's test, n = 4). (B) The expression levels of HO‐1 protein in the liver and WAT of the rats administered vehicle or 300/47.1 mg·kg−1 ALA/SFC were analyzed by immunoblotting. (C) The relative expression levels of HO‐1 protein to β‐actin. The expression levels of 300/47.1 mg·kg−1 ALA/SFC‐administered group are shown as relative values compared to those of the vehicle‐administered group (Set to 1.0). ***P < 0.001 vs the vehicle‐administered group (Student's t‐test, n = 4).
