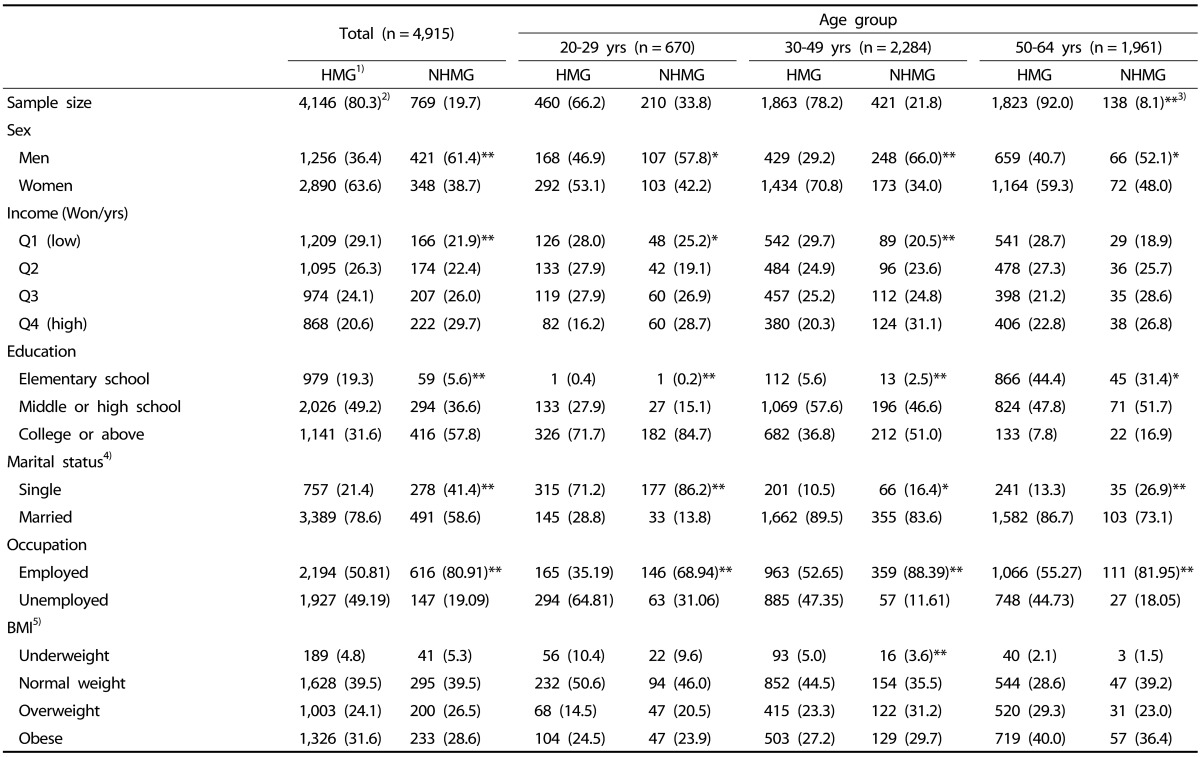
Table 2. Socio-demographic characteristics of subjects by meal preparation location and age group, KNHANES 2007-2009.
1)The study subjects were divided into two groups according to the location where meals are prepared for a single day: 1) home-made meal group (HMG) (≥ 2 meals prepared at home consumed), 2) non-home-made meal group (NHMG) (≥ 2 meals prepared away from home consumed).
2)Unweighted sample size (weighted percentage)
3)P-value was obtained from the Wald Chi-square test for categorical variables and the t-test for continuous variables (* P < 0.05, ** P < 0.01).
4)Marital status was divided into two groups; single (including separated, divorced, widowed, and stayed unmarried) and married.
5)Body mass index (BMI) was calculated as weight (kg) divided by squared height (m) (kg/m2); underweight: < 18.5 kg/m2; normal weight: 18.5 to > 23 kg/m2; overweight: 23 to < 25 kg/m2; and obese: ≥ 25 kg/m2.

