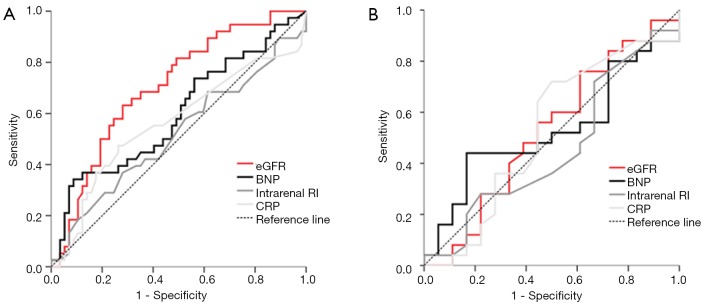
Figure 3.
ROC curves for pre-interventional eGFR, BNP, intrarenal RI, and CRP for the prediction of renal function improvement at 6 months after renal angioplasty and stenting for renal artery stenosis. (A) The area under the ROC curve for the overall cohort (n=127) was 0.71 (95% CI, 0.61–0.81; P<0.001), 0.59 (95% CI, 0.48–0.70; P=0.101), 0.52 (95% CI, 0.41–0.65; P=0.66), and 0.56 (95% CI, 0.44–0.68; P=0.30), respectively; (B) the area under the ROC curve for patients with impaired pre-interventional renal function (eGFR <60 mL/min/1.73 m2) (n=56) was 0.55 (95% CI, 0.39–0.72; P=0.53), 0.48 (95% CI, 0.32–0.65; P=0.817), 0.52 (95% CI, 0.34–0.69; P=0.84), and 0.43 (95% CI, 0.26–0.60; P=0.42), respectively. Diagonal line, no discrimination. ROC, receiver operator characteristic; eGFR, estimated glomerular filtration rate; BNP, B-type natriuretic peptide; RI, resistance index; CRP, C-reactive protein.

