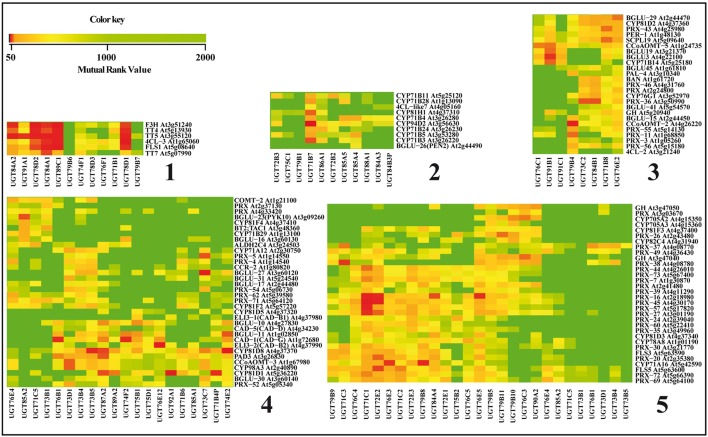
Figure 3.
Co-expression of UGT and phenylpropanoid genes. Five relevant groups of coexpressed genes delimited by hierarchical clustering indicated on the left of the heatmap were extracted from the global heat map presented in Supplementary Figure 1. Groups 1, 2, and 5 contain genes known to be involved in the glycosylation of the major phenylpropanoids and groups 3 and 4 contain genes with high coregulation values. When the mutual rank (MR) value <0, there is co-expression a50, co-expression between the genes is considered as strong; if 51 < MR < 1000, there is co-expression and if MR>1001, there is no co-expression.

