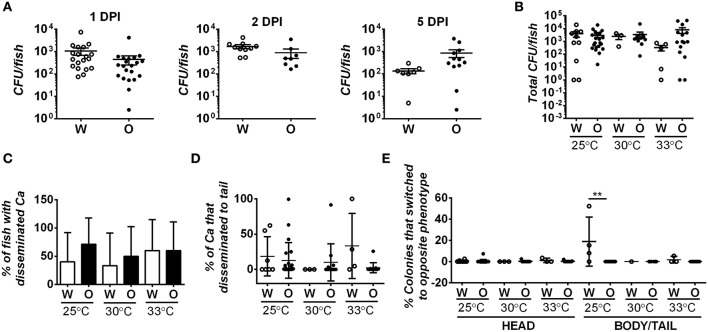
Figure 4.
Fungal burden and degree of dissemination is similar in zebrafish infected with white or opaque cells. For these experiments zebrafish were injected with 21–50 C. albicans white cells (W) or opaque cells (O) (strains CAY4975 and CAY4986, respectively). Data are a compilation of nine individual experiments. (A) Fish were housed at 30°C and homogenized at 1, 2, or 5 days post-infection (DPI). Fungal burdens were determined by plating for colony forming units (CFUs). Each dot represents an individual fish and shown are the mean CFUs ± SEM. A Student's t-test was performed and no significant differences were present between white- and opaque-infected fish. (B) White- and opaque-infected zebrafish were housed at 25, 30, or 33°C. At 2 days post-infection fish were euthanized and heads were dissected from bodies/tails. Serial dilutions of each segment were separately plated for CFUs. Plotted are the mean CFU per fish (head and body/tail segments combined) ± SEM. (C) To determine the degree of C. albicans (Ca) dissemination, white- and opaque-infected zebrafish were euthanized and fish dissected into two segments (head and body/tail). Serial dilutions of both segments were plated for CFUs, and if cells were present in the body/tail then fish were scored as exhibiting dissemination. Error bars represent SD. (D) White- and opaque-infected zebrafish were analyzed at 2 days post-infection at each of the three indicated temperatures. Fish were euthanized and heads were dissected from bodies/tails. Serial dilutions of these segments were plated for CFUs and the percentage of C. albicans cells that had disseminated into the body/tail compared to that present in the head segment. Plotted are the mean percentages of disseminated C. albicans cells ± SD. (E) Two days post-infection fish were euthanized and heads were dissected from bodies/tails. Serial dilutions of each segment were plated to determine the phenotypic state of each cell. Those that had switched from the parental white (W) or opaque (O) state to the opposite phenotypic state are shown for both head and body/tail segments. Data is the mean ± SD. **p < 0.01.

