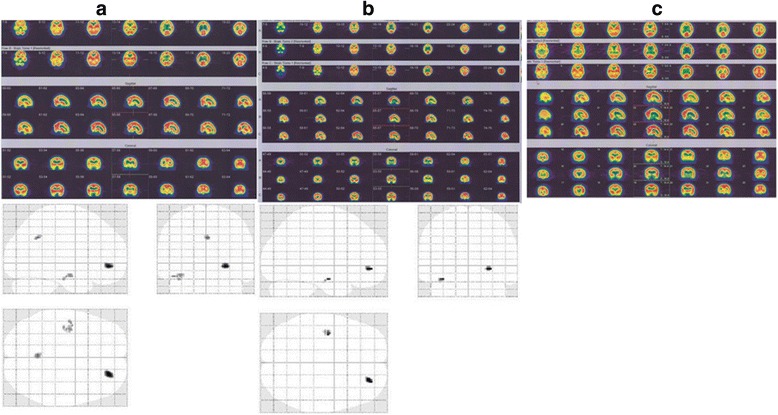
Fig. 6.

Brain Perfusion SPECT and statistical parametric mapping analysis of a MS patient underwent HBOT. First brain perfusion study of MS woman patient showed moderate hypoperfusion of inferior temporal lobe on the right side (a). Second brain perfusion study 33 days after first study and following first oxygen therapy showed mild and moderate hypoperfusion of inferior temporal lobe on the right side at first scan (no significant change in visual analysis) (b). Third brain perfusion study 4.4 months after second study and following second oxygen therapy showed rather normal radiotracer distribution through the cortical and subcortical regions (significant changes on visual analysis) (c). The upper rows indicate transverse 99mTc-ECD SPECT images; the middle rows indicate sagittal 99mTc-ECD SPECT images; and the lower rows indicate coronal 99mTc-ECD SPECT images
