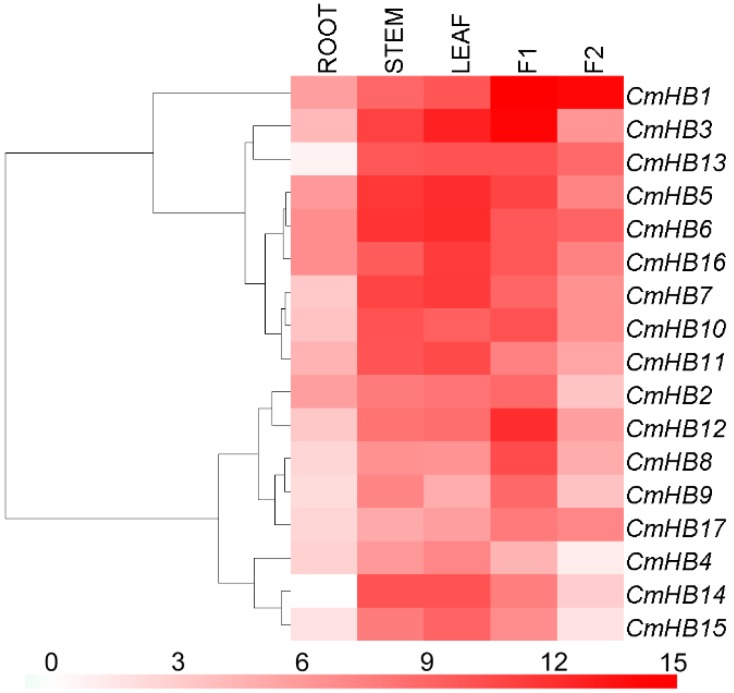
Figure 3.
Differential transcription of CmHB genes. F1, tubular florets; F2, ray florets at the budding stage. White and red indicate lower and higher transcript abundance, respectively. The relative expression levels of each CmHB gene were log2 transformed, the lowest expression level was defined as control (zero).

