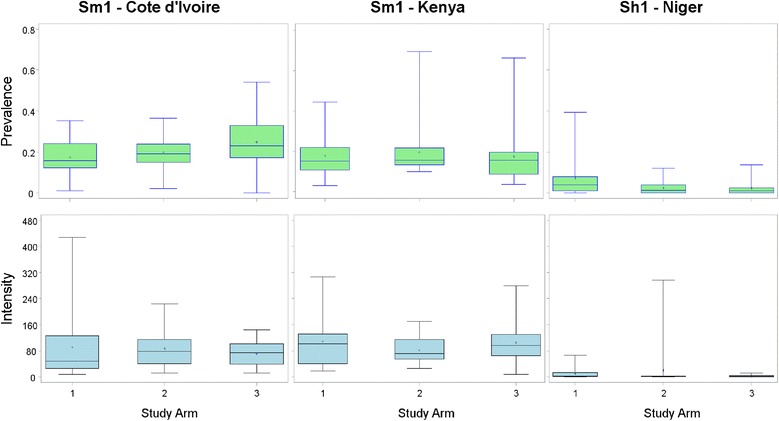
Fig. 3.

Infection prevalence and intensity for sustaining control of schistosomiasis studies, by study arm. Figures depict box plots. Horizontal lines in box interiors indicate medians. Box lengths represent the interquartile range (i.e. amount of data between the 75th and 25th percentile), + signs in boxes represent mean infection intensity (eggs per gram of faeces (for S. mansoni) or eggs per 10 ml of urine (for S. haematobium)) or prevalence in the respective arms 1–3 and the whiskers represent the minimum and maximum infection prevalence or intensity. Sh1, sustaining study in S. haematobium endemic villages; Sm1, sustaining study in S. mansoni endemic village
