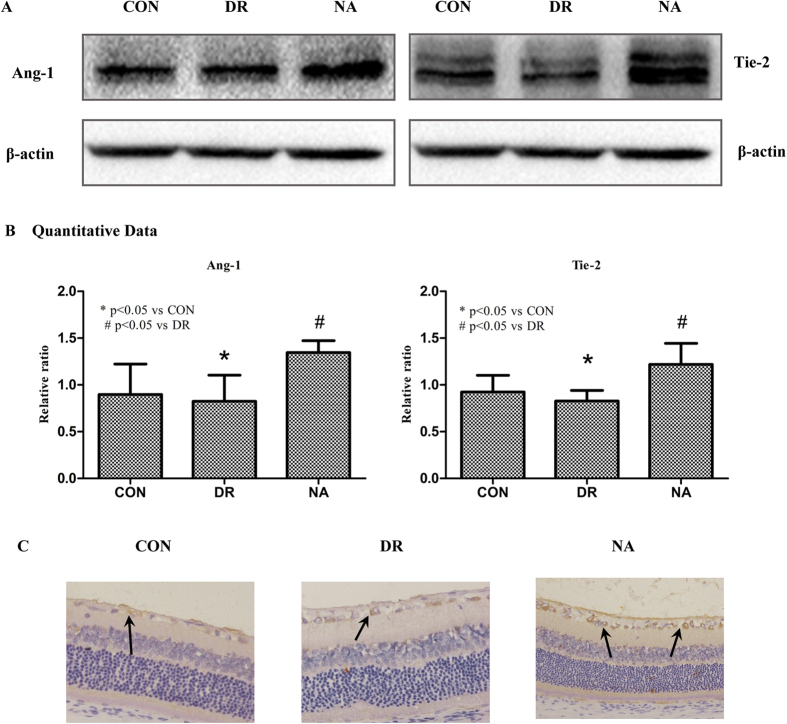
Figure 5. Niaspan treatment increases Ang-1 and Tie-2 in the DR rats compared to non-Niaspan treatment DR rats.
(A,B) Western blot and quantitative measurement for Ang-1 and Tie-2 expressions in the retina (n = 4/group). (C) Immunostaining and quantitative data for Tie-2 expression in the retina (n = 7/group). *P < 0.05 compared with nondiabetic retina (CON). #P < 0.05 compared with diabetic retina (DR).

