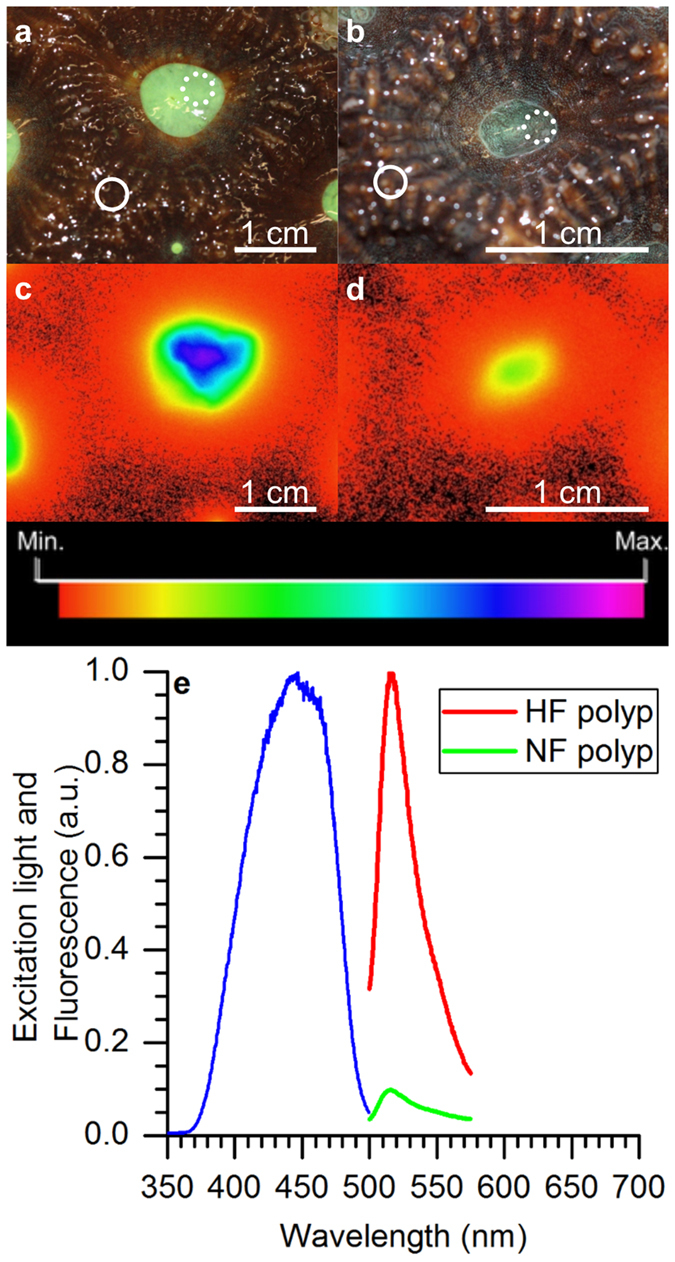
Figure 1. Green fluorescence emission of Dipsastraea sp.

Representative images of (a,c) the highly fluorescent (HF) fragment, and (b,d) the normal fluorescent (NF) fragment. (a,b) White light illumination images of typical polyp (dotted circles) and coenosarc (solid circles) measurement locations. Measurements over coenosarc tissue were performed at the intersection of three neighbouring polyps and measurements on polyp tissues avoided the immediate polyp mouth opening (see methods). (c,d) Images of green fluorescence (500–575 nm) emission following blue light excitation (peaking at 480 nm). The aperture was f/2 and f/1.4 for (c,d) respectively. (e) Spectral characteristics of Dipsastraea sp. showing the spectrum of the broadband excitation source (blue line; peak = 450 nm) and emission spectrum (peak = 516 nm) for HF polyp (red) and NF polyp (green). White scale bars indicate 1 cm.
