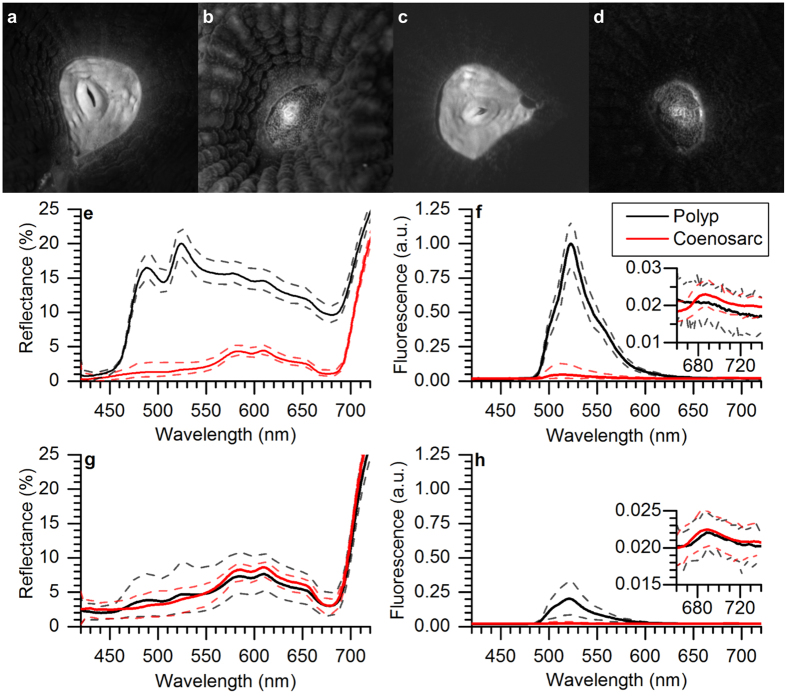
Figure 2. Hyperspectral imaging of reflectance and fluorescence of Dipsastraea sp.
(a–d) Hyperspectral images showing reflectance at 520 nm (a,b) and fluorescence (about 520 nm) (c,d) of a single polyp and surrounding coenosarc tissue area for a HF fragment (a,c) and a NF fragment (b,d). (e,f) Reflectance and fluorescence spectra of a HF fragment and (g,h) reflectance and fluorescence spectra of a NF fragment (blue excitation λmax ~ 460 nm) extracted from hyperspectral image stacks for polyp and coenosarc tissue areas of interest. Inserts in (f,h) shows the much weaker Chl a fluorescence within the same investigated areas. Solid lines represent means and dashed lines the standard error of the mean (n = 3).

