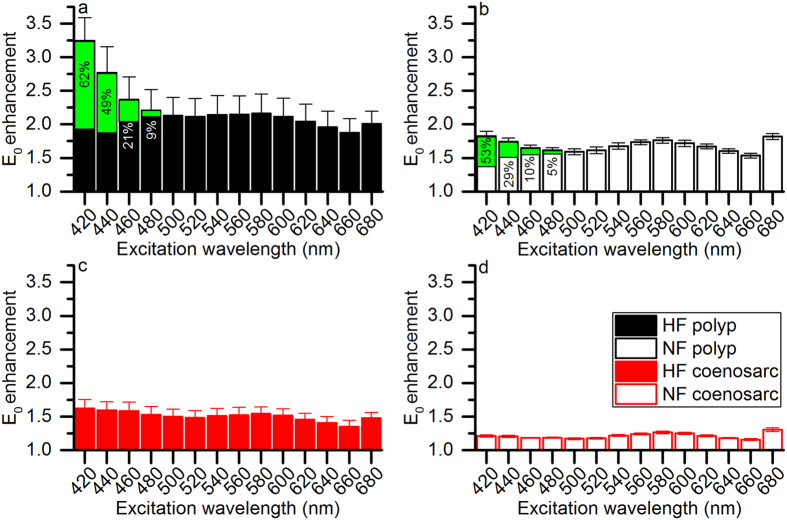
Figure 6. Coral tissue surface scalar irradiance enhancement as a function of excitation spectra.
Scalar irradiance enhancement factors were calculated by integrating the mathematical area (between 400–700 nm) under the scalar irradiance raw spectra measured on the coral tissue surface (E0) and dividing it by the respective value extracted from the Ed spectrum. The contribution of green fluorescence to scalar irradiance enhancement is shown in green area and indicated as % of total enhancement for each spectral band. Note that minor green fluorescence contributions of <5% are not shown. Measurements were performed for (a) HF polyp, (b) NF polyp, (c) HF coenosarc and (d) NF coenosarc tissues (n = 3).

