
Figure 7. Coral tissue surface scalar irradiance enhancement and tissue heating.
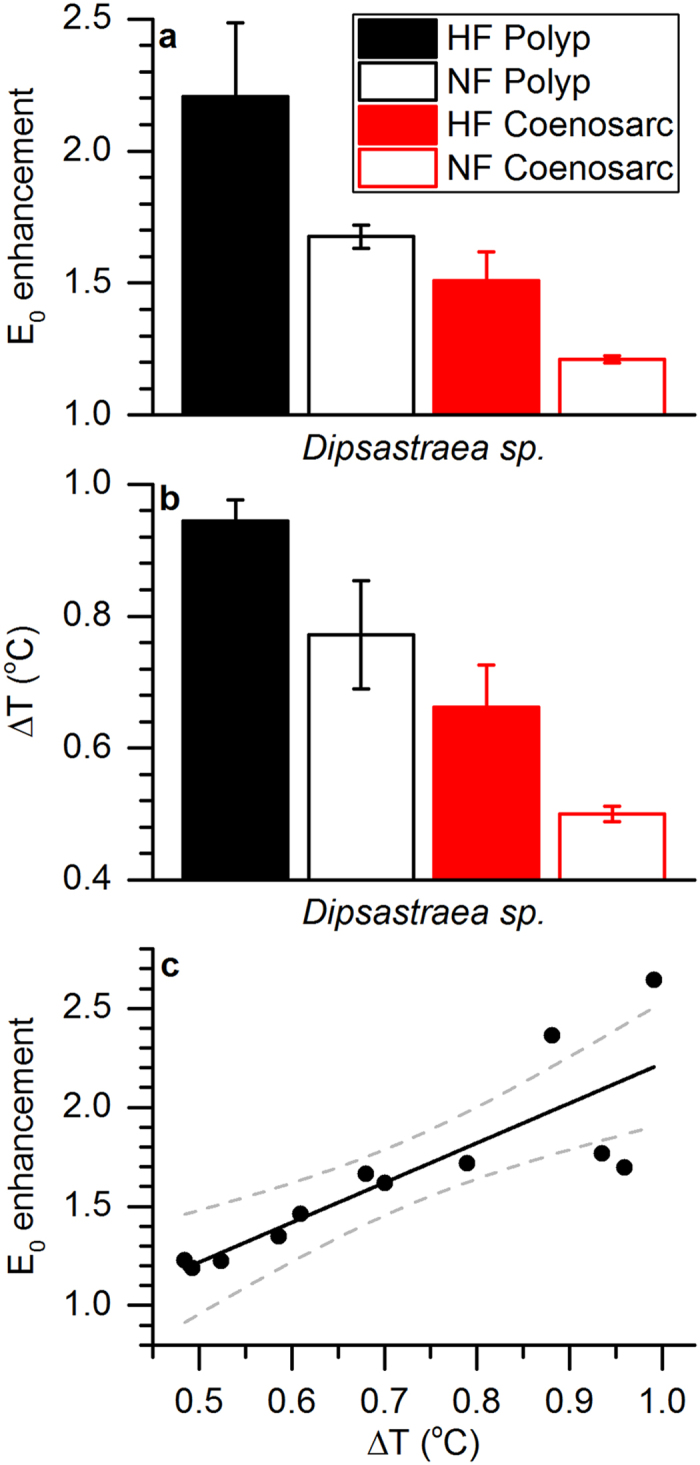
(a,b) Average values for (a) coral tissue surface scalar irradiance (E0) enhancement factors and (b) tissue heating (ΔT, °C) both for excitation integrated between 400–700 nm. Columns are arranged in order of descending measured green fluorescence (i.e. HF polyp, NF polyp, HF coenosarc and NF coenosarc) and represent means ± s.e.m. (n = 3). (c) Positive correlation between tissue surface scalar irradiance enhancement and tissue heating. The black line shows a linear fit and the dotted lines represent the 95% confidence intervals (R2 = 0.84).