
Figure 5. The OSI distribution from different ages and laminar layers of the S334ter-3 rats.
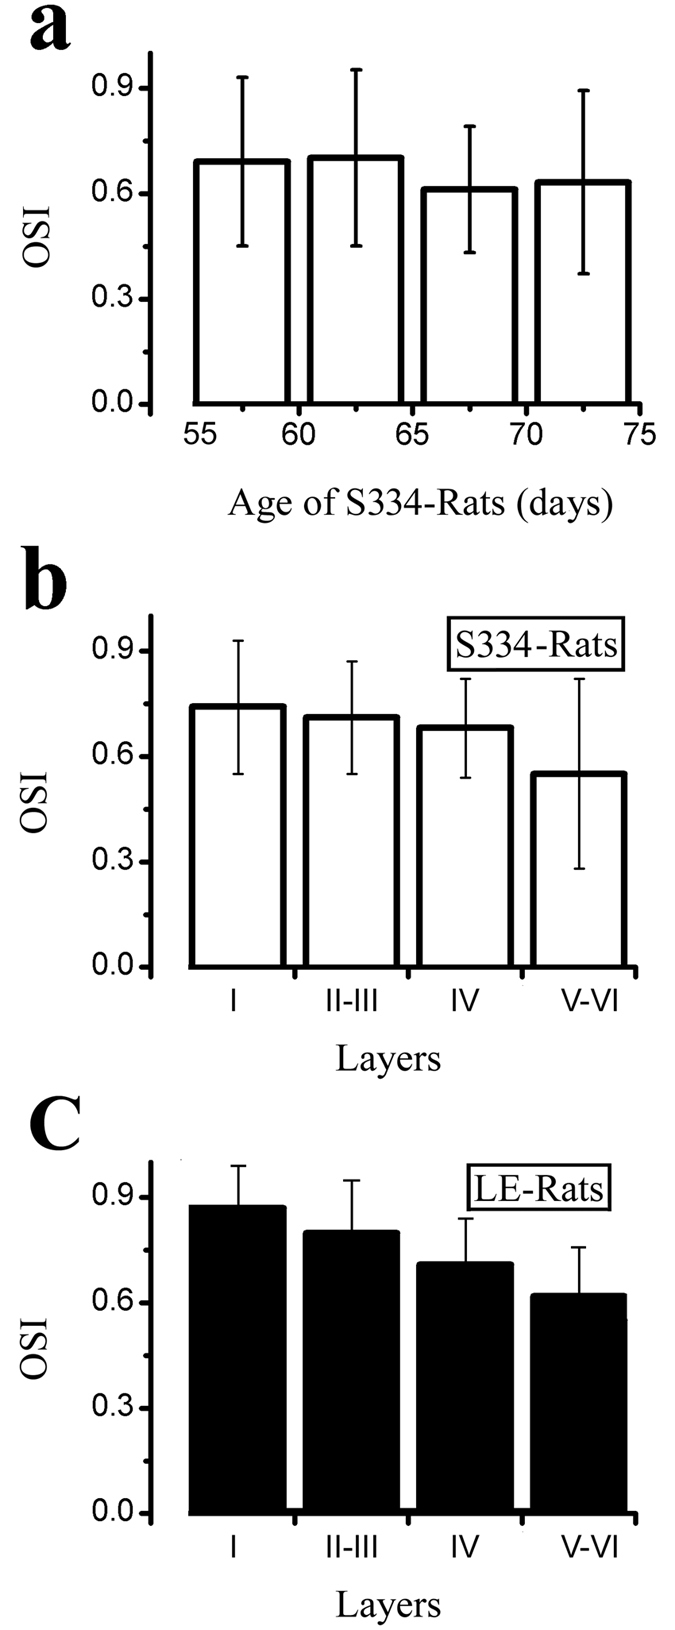
(a) Histogram of OSIs at different ages in S334ter-3 rats. (b,c) Histogram of OSIs at different laminar layers in S334ter-3 rats (b) and LE rats (c).
Official websites use .gov
A
.gov website belongs to an official
government organization in the United States.
Secure .gov websites use HTTPS
A lock (
) or https:// means you've safely
connected to the .gov website. Share sensitive
information only on official, secure websites.
(a) Histogram of OSIs at different ages in S334ter-3 rats. (b,c) Histogram of OSIs at different laminar layers in S334ter-3 rats (b) and LE rats (c).