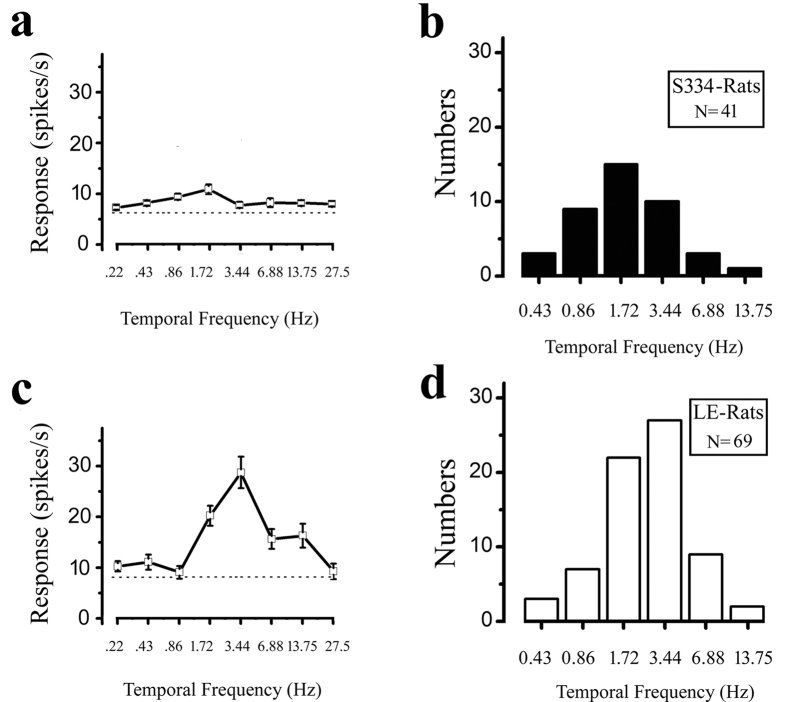
Figure 7. Distribution of the optimal temporal frequency for the S334ter-3 and LE rats.
Example ((a) P65) and histogram (b) of the optimal spatial frequency from S334ter-3 rats. Example (c) and histogram (d) of the optimal spatial frequency from LE rats. The dotted line indicates the spontaneous response. Error bars represent the SEM values.

